Wuthering Waves Performance & Stutter: Engine Architecture, Hardware Misconceptions, and the Real Cost of Live-Service
Wuthering Waves Performance & Stutter: Engine Architecture, Hardware Misconceptions, and the Real Cost of Live-Service
Preface
As a follow-up to the storage bloat analysis (https://pqmlmaoxd.github.io/gamedev/analysis/2026/03/15/wuthering-waves-memory-bloat.html), today I want to go deeper into something more contested: why WuWa performs the way it does, and whether the community complaints are actually fair.
Some context before we start: I spent a significant amount of time on this because I genuinely wanted to know whether the frustration was justified — or whether people were blaming developers for problems that go a lot deeper than implementation quality.
This post is not a defense of Kuro Games. It is also not a list of excuses. What it is, I hope, is an honest attempt to explain why the performance situation is considerably more complicated than “the devs didn’t optimize” or “skill issue.”
⚠️ Warning: This post is significantly more technical and academic than the memory bloat article before it. It covers CPU architecture, engine threading models, garbage collection mechanics, and data-oriented programming — if that starts to feel overwhelming, feel free to skip straight to the TL;DR at the end.
The Problem Nobody Can Agree On
I keep seeing the same complaints across Reddit, Discord, and YouTube:
- “Startorch Academy is stuttering badly on my mid/high-end PC — what is going on.”
- “The devs just don’t give AF about optimization, they just keep pushing flashy effects…”
- “Look at AKE, Genshin, RDR2 — they all run smoothly. WuWa can’t do it after 2 years of development?”
What nobody in those threads distinguishes is that “the game performs badly” is actually describing at least two completely separate phenomena — with different root causes, different locations on the map, and different fix timelines.
Pattern A — Stutter while inside the city. Microstutters, unstable frame pacing, FPS that never quite locks. This happens in Startorch Academy, in Septimont, in any dense populated area — regardless of whether you are in combat or just walking. GPU load is often unremarkable in this pattern. The dominant limiter is CPU-side coordination rather than raw GPU throughput.
Pattern B — Hard freeze when leaving the city. This one is harder to forget: you cross the boundary, and the game drops to 0 FPS for 500ms to a few seconds, then recovers completely. Players who have been with WuWa since launch will remember earlier versions where this was severe. It has improved considerably through patches — v3.1’s streaming pipeline optimization made a visible difference — but it has not disappeared entirely.
These two patterns look related because they both happen near dense areas. They are not the same thing:
| Pattern | When it happens | What’s happening | Status |
|---|---|---|---|
| A — City stutter | While inside dense area | GameThread overload from active logic tick count — NPC AI, scripting, physics, interaction handlers | Engine-level ceiling, unresolved |
| B — Exit freeze | Leaving dense area | Asset streaming flush + V8 GC pressure + shader/material warmup or on-demand compilation. | Improved significantly, residual remains |
A third phenomenon exists separately from both of these:
| Also happening | When | Root cause |
|---|---|---|
| Combat FPS drops (mobile) | Dense combat with VFX | GameThread particle saturation → GPU renderer inefficiency cascade |
This post will go through all of these. More importantly, it will try to explain why they are different problems — because that context is what most community analysis misses entirely, and it changes what “optimization” even means here.
1. The Engine’s Fundamental Constraints
1.1 How a Frame Actually Gets Made in UE4
In Unreal Engine 4, every frame flows through three stages, in order:
[GameThread] ──► [RenderThread] ──► [GPU]
The GameThread is where everything that makes the game a game happens: actor updates, physics simulation, AI decisions, animation state machines, particle system tick updates, collision detection, scripting logic — all of it. Every frame. In sequence. The GameThread is the central coordination point that all game logic must pass through before work can be dispatched downstream.
A clarification worth making here: UE4 does have a TaskGraph system that allows some async work to be dispatched to worker thread groups — WuWa’s client log confirms this, showing NP (Normal Priority), HP (High Priority), and BP (Background Priority) task thread groups active at runtime. This means WuWa is not running a completely single-threaded model. However, TaskGraph parallelism does not eliminate the GameThread as a bottleneck — it reduces some of the work. The GameThread remains the mandatory coordination and synchronization point. Gameplay APIs, AI state, scripting logic, and actor tick coordination that are not thread-safe by design must still pass through it. When that coordination overhead saturates, downstream threads wait regardless of how many workers exist.
When the GameThread finishes, it hands a list of rendering commands to the RenderThread. The RenderThread prepares those commands for the GPU. And here is the critical part: the two threads synchronize at the end of each frame. Neither can start the next frame until both are done with the current one.
From Epic’s own documentation:
“In Unreal Engine 4 (UE4), the entire renderer operates in its own thread that is a frame or two behind the game thread.” “The game thread inserts the command into the rendering command queue… RHI functions can only be called from the rendering thread.”
Source: https://dev.epicgames.com/documentation/unreal-engine/threaded-rendering-in-unreal-engine
In simple terms: if the GameThread is slow, the RenderThread waits. The GPU idles. You get a frame spike. It doesn’t matter how fast your GPU is — it has to wait for the GameThread to finish feeding it work.
Historical context — why this is more visible now than it used to be
UE4’s coordination model has existed for multiple engine generations. This is not a new limitation. What has changed is the environment in which the engine now operates.
When UE4 was introduced in the early 2010s, it was designed around very different hardware and content expectations: CPUs commonly ranged from 2–4 cores, HDDs were still widespread and constrained streaming, target frame rates were often 30–60 FPS with larger frame time budgets, and game worlds were comparatively less complex.
Over time, both hardware and game design have evolved in ways that increase per-frame workload without a corresponding increase in the engine’s ability to parallelize that work: CPUs now offer significantly higher core counts, but not proportionally higher single-thread performance; SSDs have removed many I/O constraints, enabling more aggressive streaming and larger worlds; modern titles target higher visual fidelity, denser environments, and more complex simulation systems.
As a result: the same architectural constraints that once operated within comfortable margins are now being reached — and exceeded — more frequently. This is why bottlenecks that were once occasional or situational have become persistent and highly visible in modern titles. The issue is not simply that the engine is “old,” but that modern workloads are now consistently pushing the engine’s coordination model to the edge of its design limits.
— @argon1ut
The Timeline Problem — Why This Isn’t Fixed Yet
One piece of context missing from most performance discussions: the industry is not operating on a single timeline. There are three separate timelines moving at different speeds:
- Engine evolution (fast) — Unreal Engine continues to introduce new systems, improved threading models, and experimental data-oriented frameworks.
- Game development cycles (medium) — large-scale games take 5–6 years to build, locking in architectural decisions long before release.
- Ecosystem adoption (slow) — tooling, workflows, and developer experience evolve gradually, often across multiple projects.
These timelines do not align. A game releasing in 2025 was likely designed around 2019–2020 assumptions — before many modern engine improvements existed or were production-ready. Even when new systems are available, they cannot be retroactively applied without significant risk to an active project.
This creates a structural lag: by the time engine-level solutions exist, the games that would benefit from them are already too far into development to adopt them. The GameThread model, AActor system, and object-oriented design remain in place not because they are optimal, but because they are foundational to a massive existing ecosystem that depends on stability and backward compatibility.
The outcome is a transitional period: engines are improving, hardware is improving — but shipped games are still built on older assumptions. The industry is currently shipping the last generation of designs against the first generation of their replacements.
Modern games are exposing problems from yesterday’s engine architecture, using today’s content scale, before tomorrow’s solutions are production-ready.
— @argon1ut
Think of it like a restaurant kitchen where every order — no matter how simple — must be personally reviewed and signed off by the head chef before it goes out. The kitchen has 16 sous chefs standing ready. But every ticket still waits for the head chef’s signature. More sous chefs don’t help. A faster head chef helps a little. The bottleneck is the process, not the people.
In UE4, the GameThread is the head chef. Every piece of game logic needs its sign-off every frame, in sequence, before anything moves forward.
The diagnostic command stat unit in UE4 breaks out Game, Draw, and GPU times separately. When Frame time ≈ Game time, the bottleneck is the GameThread. That is where WuWa consistently ends up in dense areas.
1.2 Why Your 6 or 8-Core CPU Cannot Fix This
This is the most counterintuitive thing in this post, so I want to be clear about it.
More CPU cores do not help a GameThread bottleneck.
A community member shared their Process Lasso capture while playing in a dense city area — the pattern is immediately recognizable:
[Image: Community Process Lasso screenshot — i7-11700F, WuWa running in city area. Client-Win64-Shipping.exe shows 319 threads spawned, but overall CPU usage reads 31% while the game simultaneously reports 100% responsiveness pressure. The CPU bar graph in the corner shows a heavily skewed distribution — one cluster of cores working hard, the majority near idle.]
Source: https://www.reddit.com/r/WutheringWaves/comments/1p2pwg0/cpu_issue_apparently_the_new_area_is_full/
The machine has plenty of compute capacity. But the work that determines whether you get a stutter — NPC behavior trees, interaction handlers, AI tick coordination, scripting logic — cannot be freely distributed across all cores. Much of it must pass through the GameThread’s coordination point before it can be dispatched to workers, and the synchronization overhead at that point is what saturates the max thread. 319 threads exist; the engine’s threading constraints limit how much of the critical path can be parallelized.
My own CapFrameX benchmarks confirm what the Process Lasso pattern shows: across two city sessions on i7-12700KF + RTX 5070, CPU max single thread peaked at 97–100% while overall CPU load averaged 40–46%. The aggregate CPU number looks fine. The per-thread story is entirely different.
The vkguide multithreading article describes this exact issue with UE4:
“You will commonly see that Unreal Engine games struggle scaling past 4 cores… A game that has lots of blueprint usage and AI calculations in UE4 will have the Game Thread busy doing work in 1 core, and then every other core in the machine unused.”
Source: https://vkguide.dev/docs/extra-chapter/multithreading/
And from Epic’s own developer documentation:
“By design, many engine APIs and gameplay operations are not thread-safe, so they must be executed on the GameThread… The Game Thread — Central Execution Thread: Coordinates all gameplay logic each frame.” “But multithreading is not always the silver bullet. Some tasks are inherently sequential, and splitting them up might introduce complexity without performance gains.”
Source: https://dev.epicgames.com/community/learning/tutorials/BdmJ/unreal-engine-multithreading-techniques
I captured two benchmark sessions on the same hardware — i7-12700KF + RTX 5070, identical settings: 1080p, settings, ray tracing, DLAA, no frame generation. Two different cities, same question: is the CPU the ceiling?
Huanglong (v1.0 city):
- Average FPS: 40.2 · CPU max thread: 97% · GPU avg: 54%
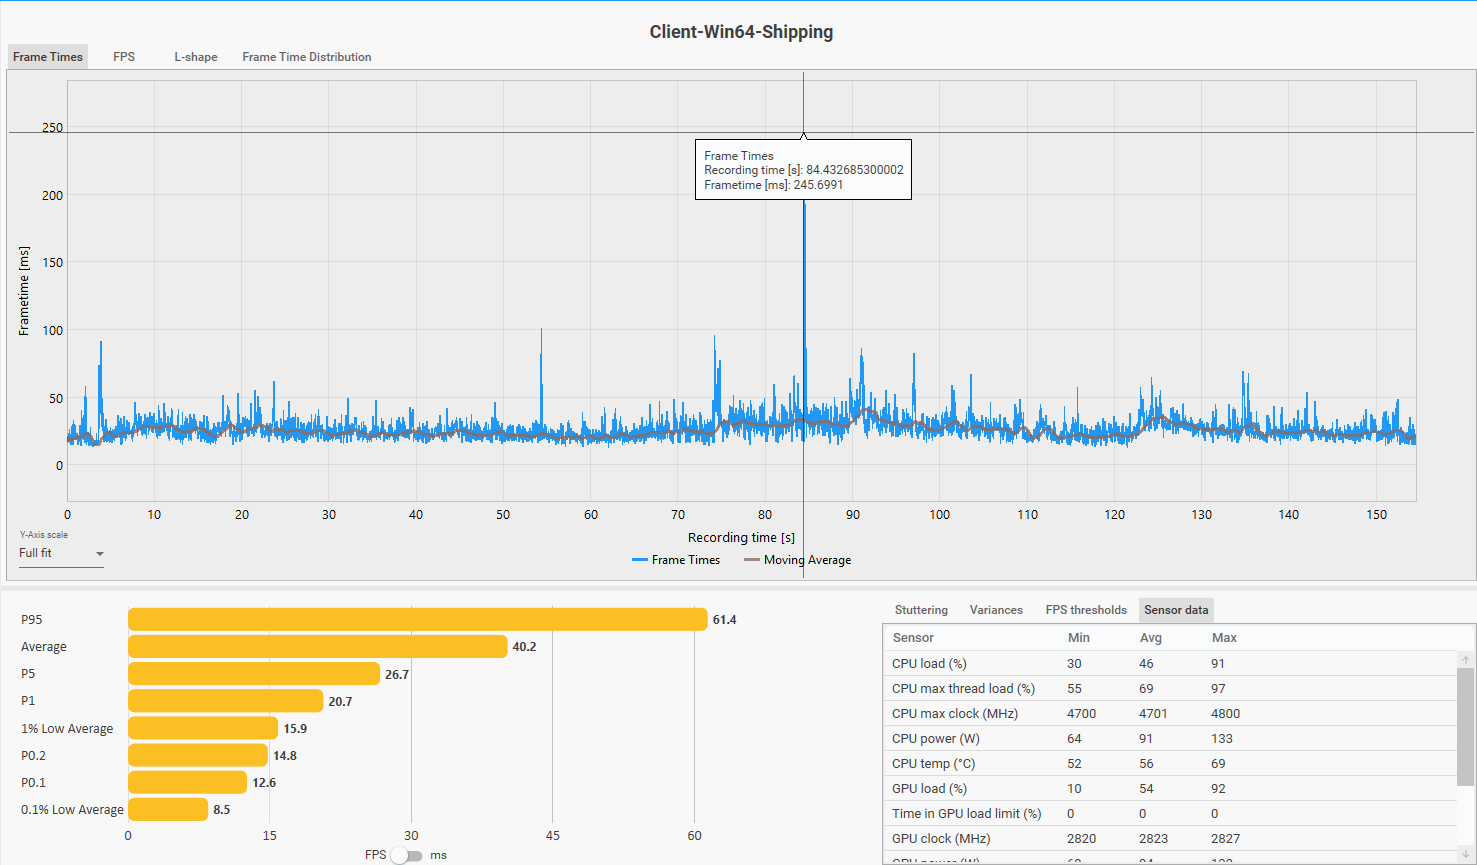 Frame time distribution during Huanglong city traversal. Note the consistent spike pattern — and the 245ms outlier at ~t=85s, deliberately triggered by flying out of the city boundary at maximum speed (Pattern B).
Startorch Academy (v3.0 city):
- Average FPS: 38.5 · CPU max thread: 100% · GPU avg: 58%
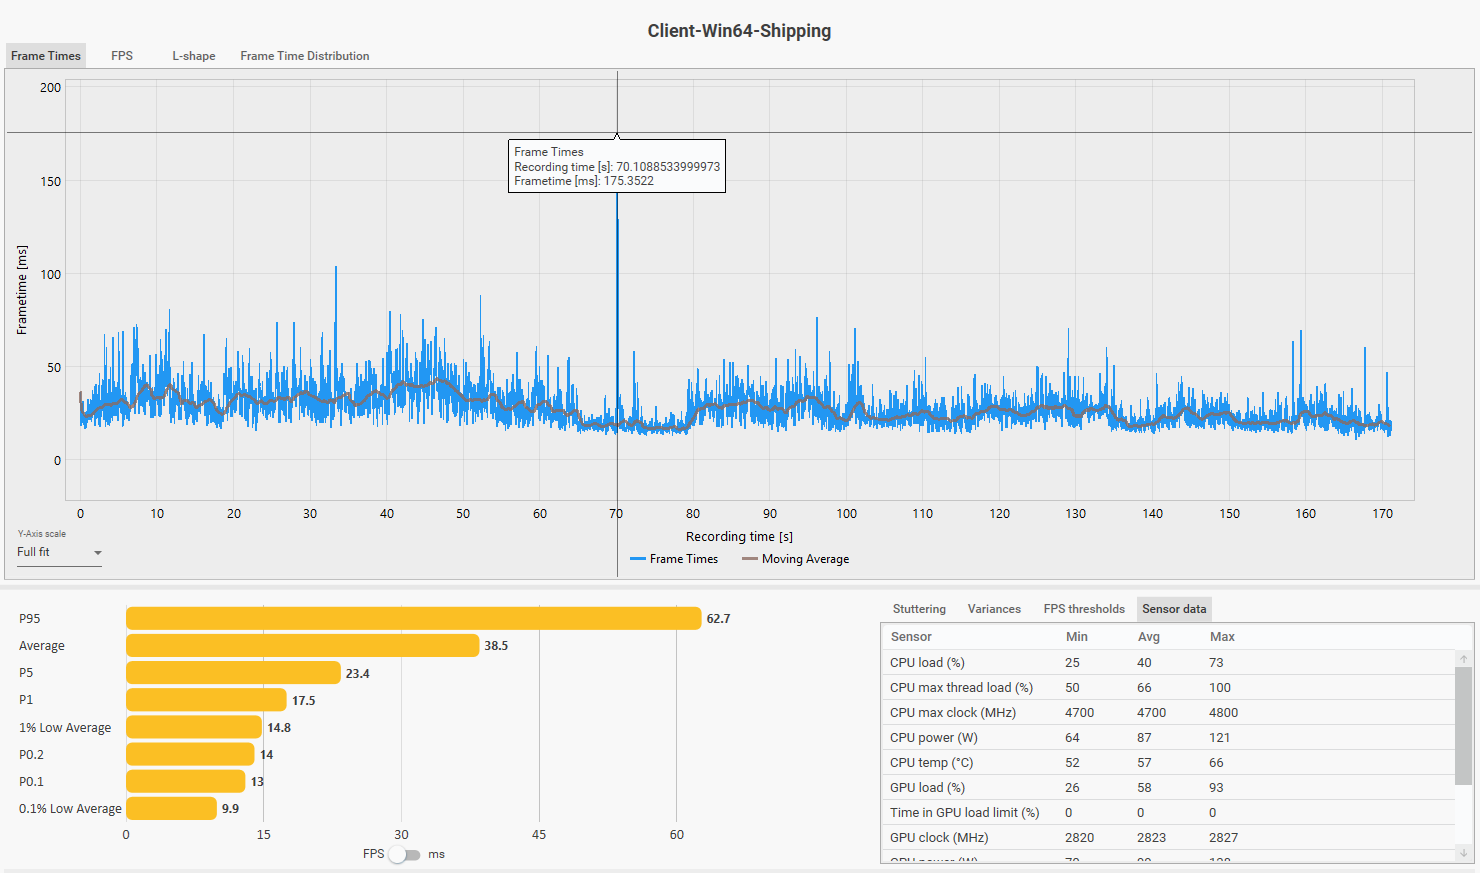 Frame time distribution during Startorch Academy traversal. The 175ms outlier spike (organic, not triggered) occurs with no GPU load correlation — consistent with a V8 GC stop-the-world pause.
Two cities. Two sessions. Same answer both times: CPU max thread saturated, GPU underutilized. The sessions corroborate each other — this is not an artifact of one area or one patch. The RTX 5070 averaging 54–58% utilization while the CPU max thread sits at 97–100% is the clearest possible signal. The GPU is waiting. This is just existing in a city — not combat, not a stress test.
Mobile thread statistics — direct confirmation:
Community member @xLOCKnLOADx (author of the Reddit mobile profiling post referenced in Section 5) provided per-thread load data from WuWa running on mobile. The thread distribution tells the story directly:
| Thread | AVG | MAX |
|---|---|---|
| GameThread | 74.9% | 93.9% |
| RenderThread | 65.1% | 83.8% |
| RHIThread | 52.1% | 69.5% |
| TaskGraphHP 3 | 13.3% | 17.4% |
| TaskGraphHP 4 | 8.5% | 12.5% |
| TaskGraphHP 5 | 6.6% | 10.3% |
| V8 DefaultWorker ×2 | 3.3% / 3.2% | 16.1% / 23.1% |
| All other threads | <5% each | — |
GameThread and RenderThread are the dominant threads. TaskGraph worker threads are active but sit at 13% and below. The V8 DefaultWorker entries are direct runtime confirmation that V8/Puerts is active alongside the main game threads.
Architecture comparison — WuWa vs Arknights Endfield:
Profiled on the same device, AKE’s thread distribution shows a fundamentally different pattern:
| Thread | AVG |
|---|---|
| UnityMain | 70.0% |
| Job.Worker 1 | 20.3% |
| Job.Worker 2 | 20.0% |
| Job.Worker 3 | 14.8% |
| Job.Worker 0 | 11.0% |
Similar main thread load (~70%), but AKE’s Job Workers are genuinely doing substantial work — 20%+ each. This is Unity’s Job System distributing simulation work across cores effectively. WuWa’s TaskGraph workers sit at 7% and below by comparison.
An important behavioral distinction also worth noting: WuWa’s worker threads display a sawtooth/burst pattern rather than sustained load. They activate in short bursts, complete tasks quickly, then stall waiting for the main thread to provide more work or resolve sync points. This is not a lack of parallel capability — it is a coordination bottleneck: the system can use more cores, but is not being fed work in a way that allows sustained parallel execution. This framing is more precise than simply saying “more cores don’t help” — the correct statement is that additional cores cannot accelerate work that remains serialized at the coordination point.
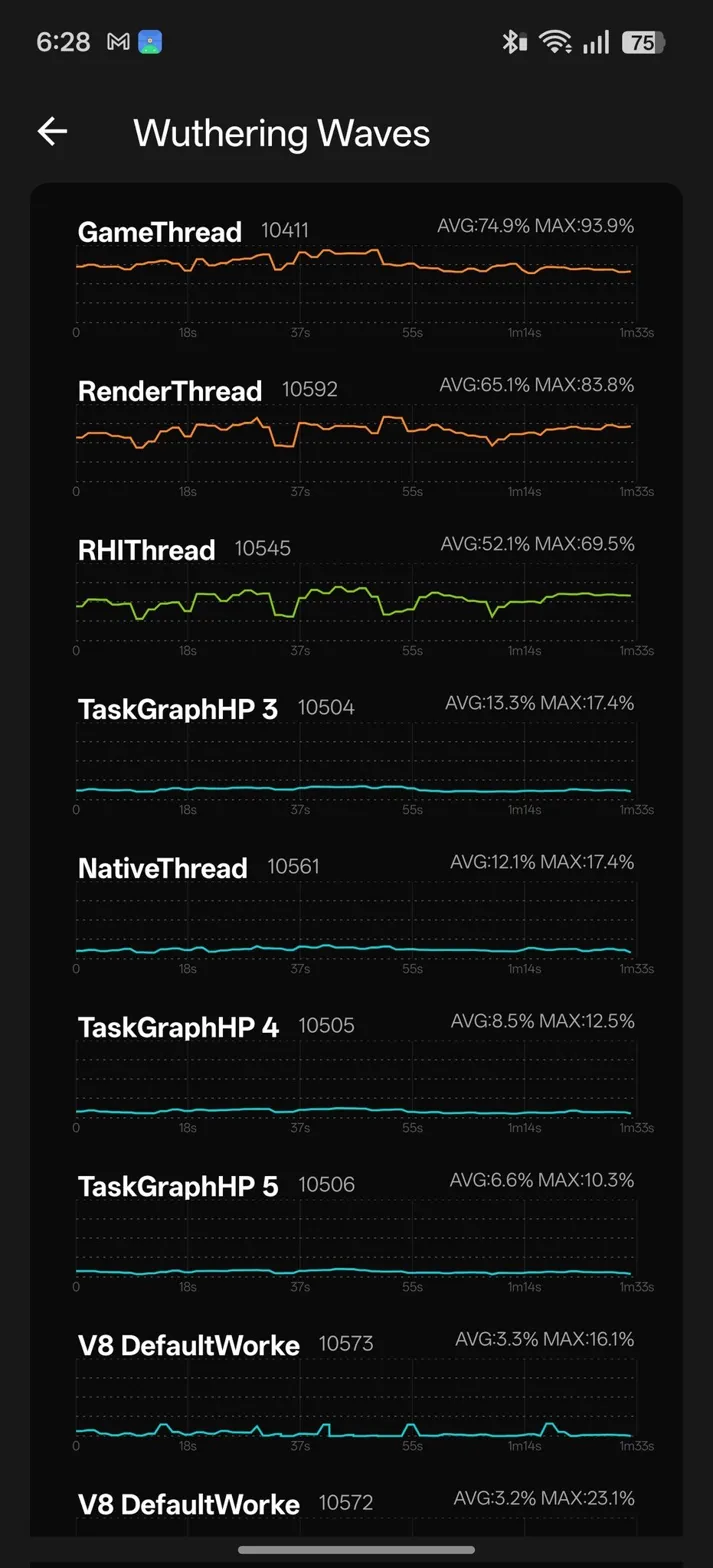 WuWa per-thread load on mobile. GameThread and RenderThread carry the overwhelming majority of work. TaskGraph workers active but contribute minimally. V8 DefaultWorker instances confirm Puerts/V8 runtime active. Source: @xLOCKnLOADx
Architecture comparison — WuWa vs Arknights Endfield:
WuWa — GameThread 74.9%, TaskGraph workers ≤13%. Source: @xLOCKnLOADx
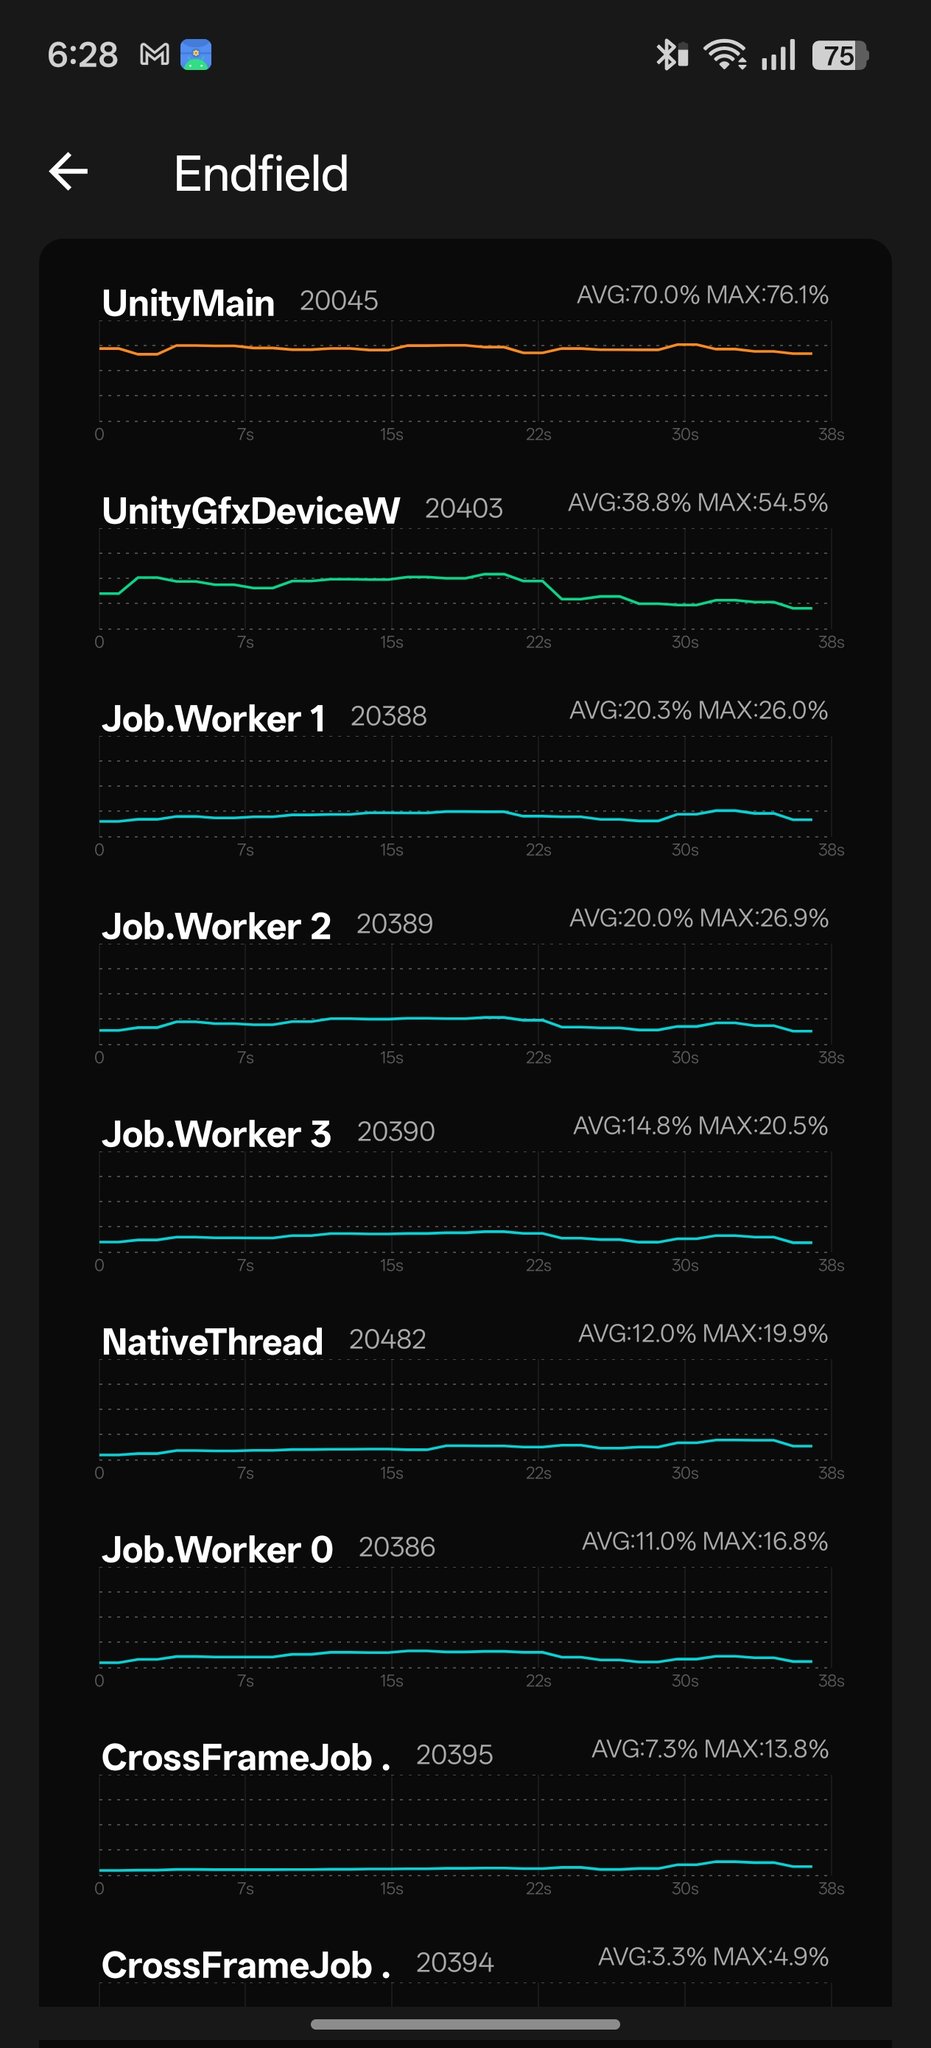
Arknights Endfield — Job Workers 20%+ each, work distributed across cores. Source: @xLOCKnLOADx
@xLOCKnLOADx summarizes the practical implication directly: “It’s basically all main thread, the threads he mentioned actually don’t do all too much work compared to a game like AKE. If an 8E chokes so badly with a beefy prime, you can only imagine how lower end hardware would struggle.”
@argon1ut Test Cases — Controlled Resolution and Settings Spectrum (Ryzen 9 7900X + RTX 5070 Ti)
Three configurations tested on the same hardware to isolate bottleneck behavior across the resolution/settings spectrum. Images: argon1ut_4k_rt_night.png, argon1ut_4k_rt_day.png, argon1ut_768p_low_fg4x.png.
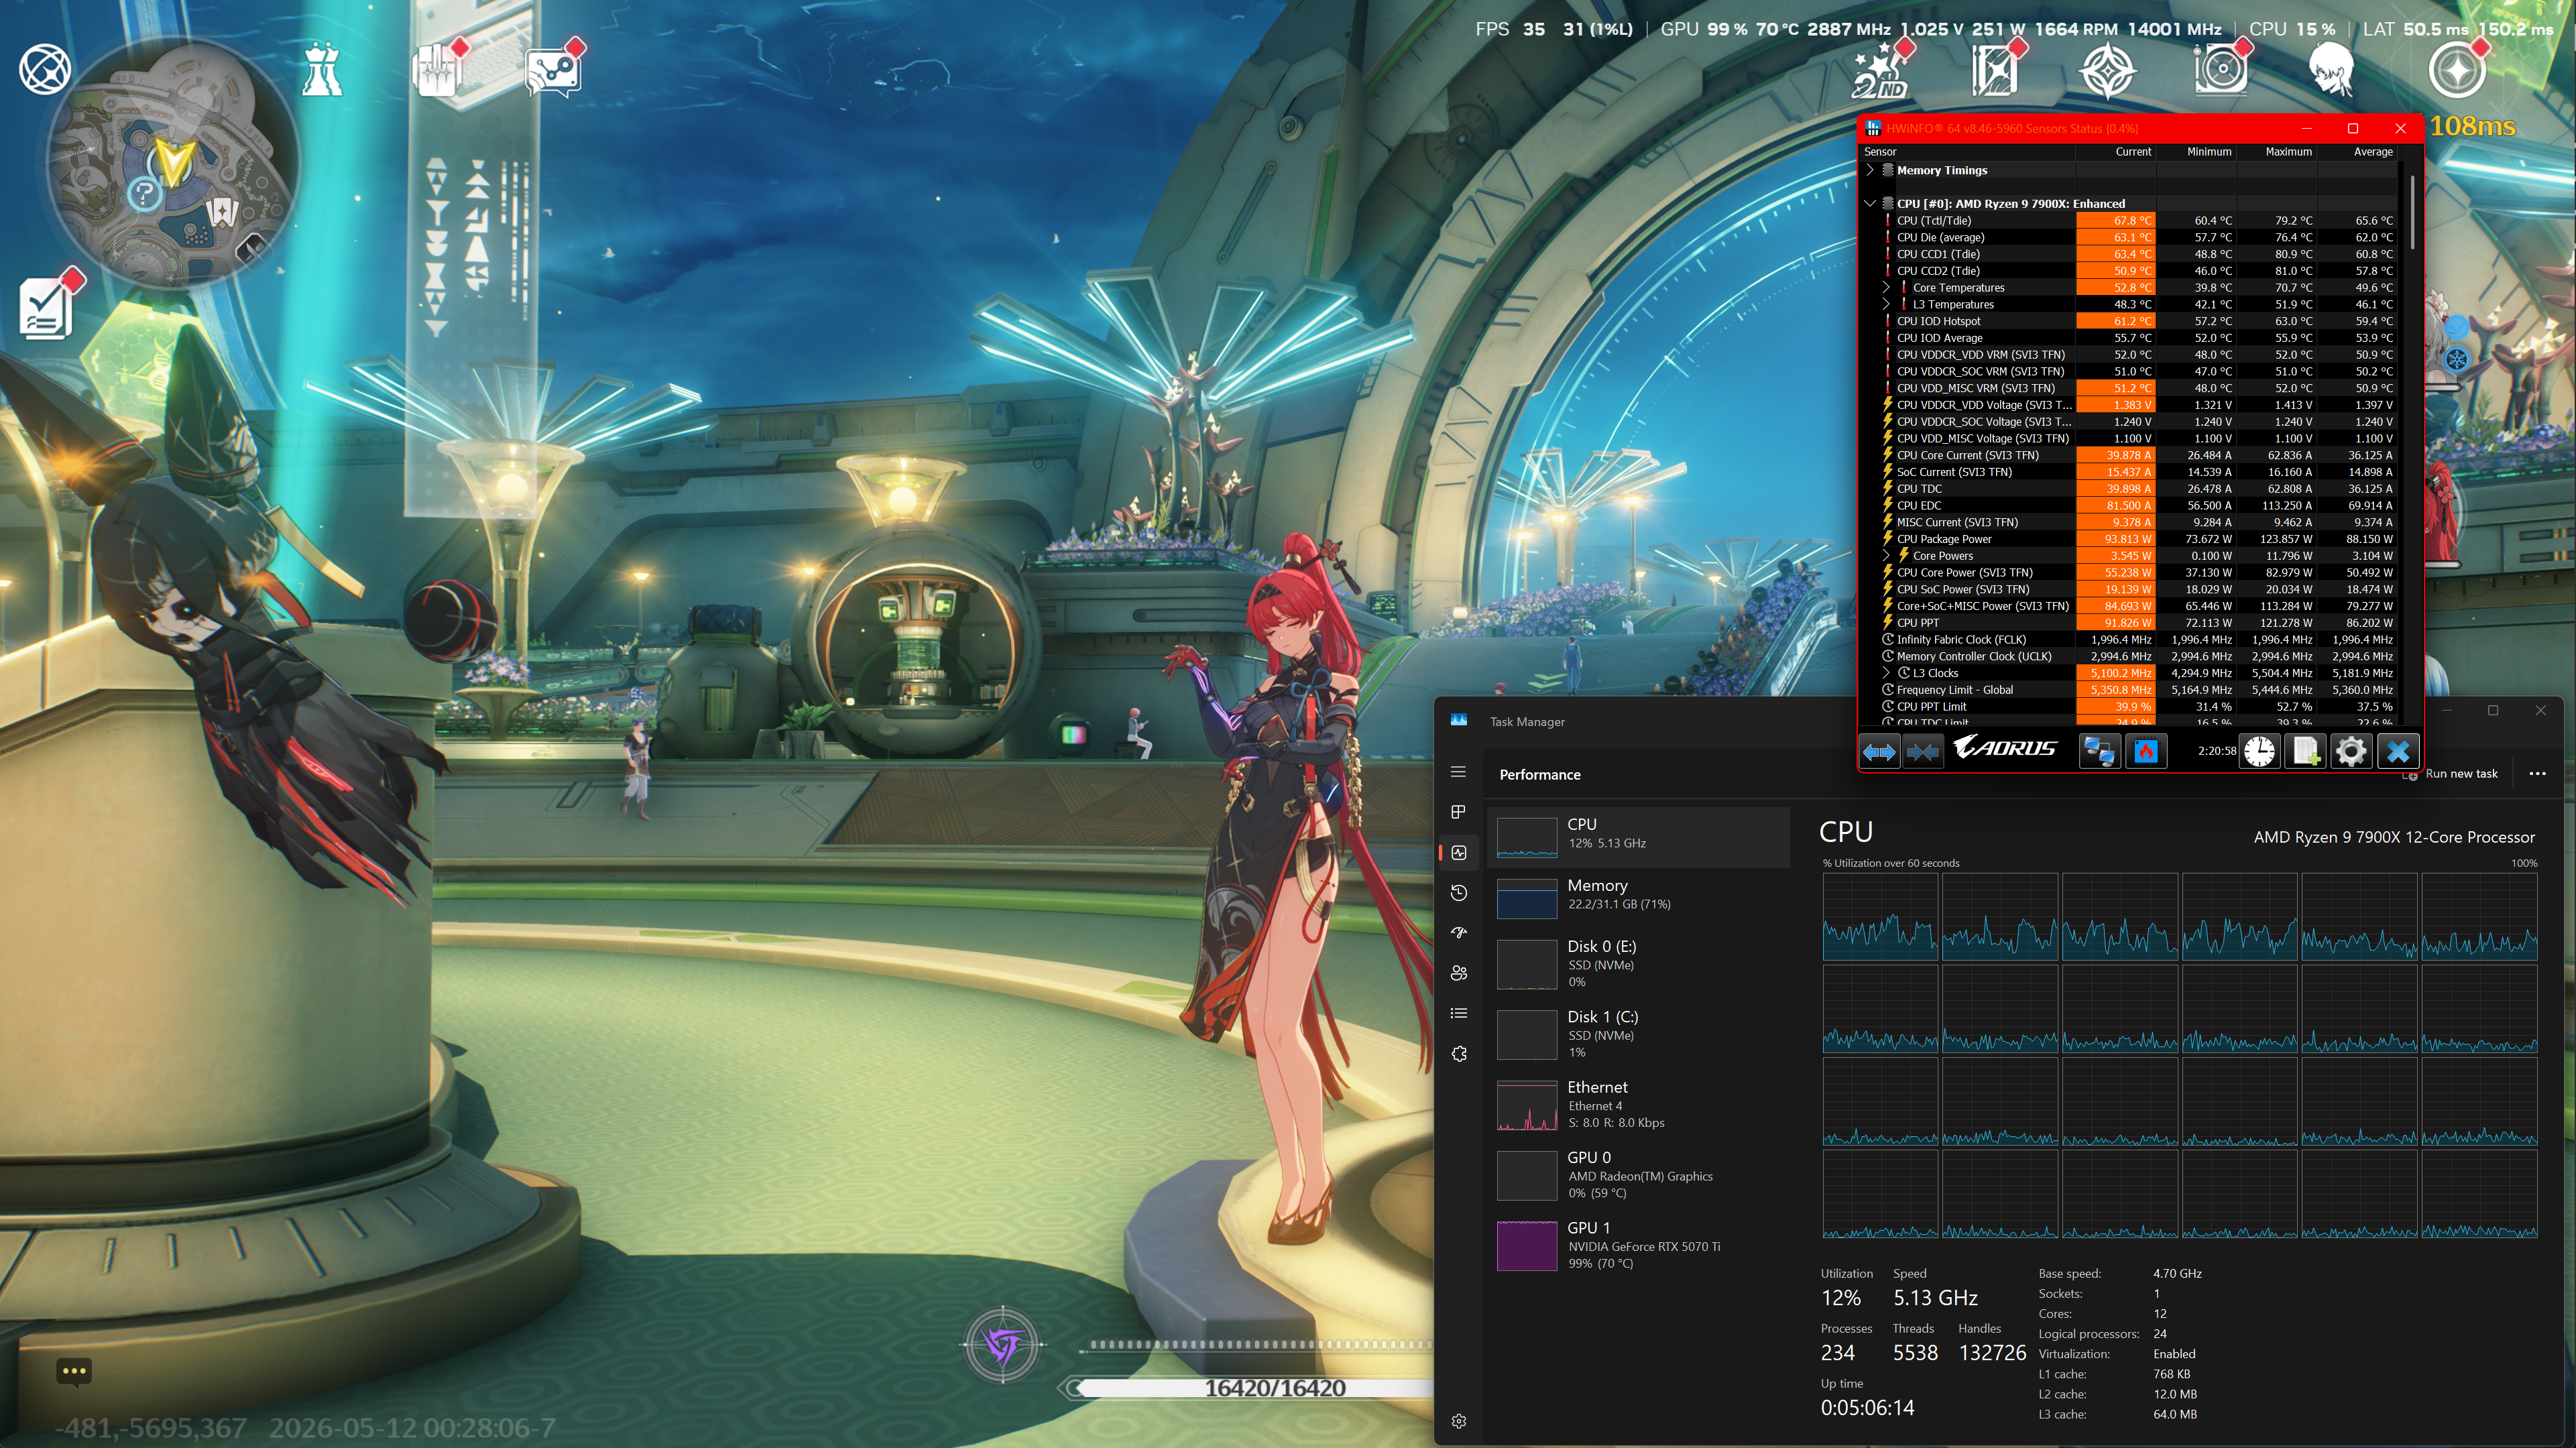
Config A — 4K DLAA, max RT, FG off, nighttime
FPS 35 · 1% low 31 · GPU 99% · CPU 12%
Latency spike 150.2ms visible
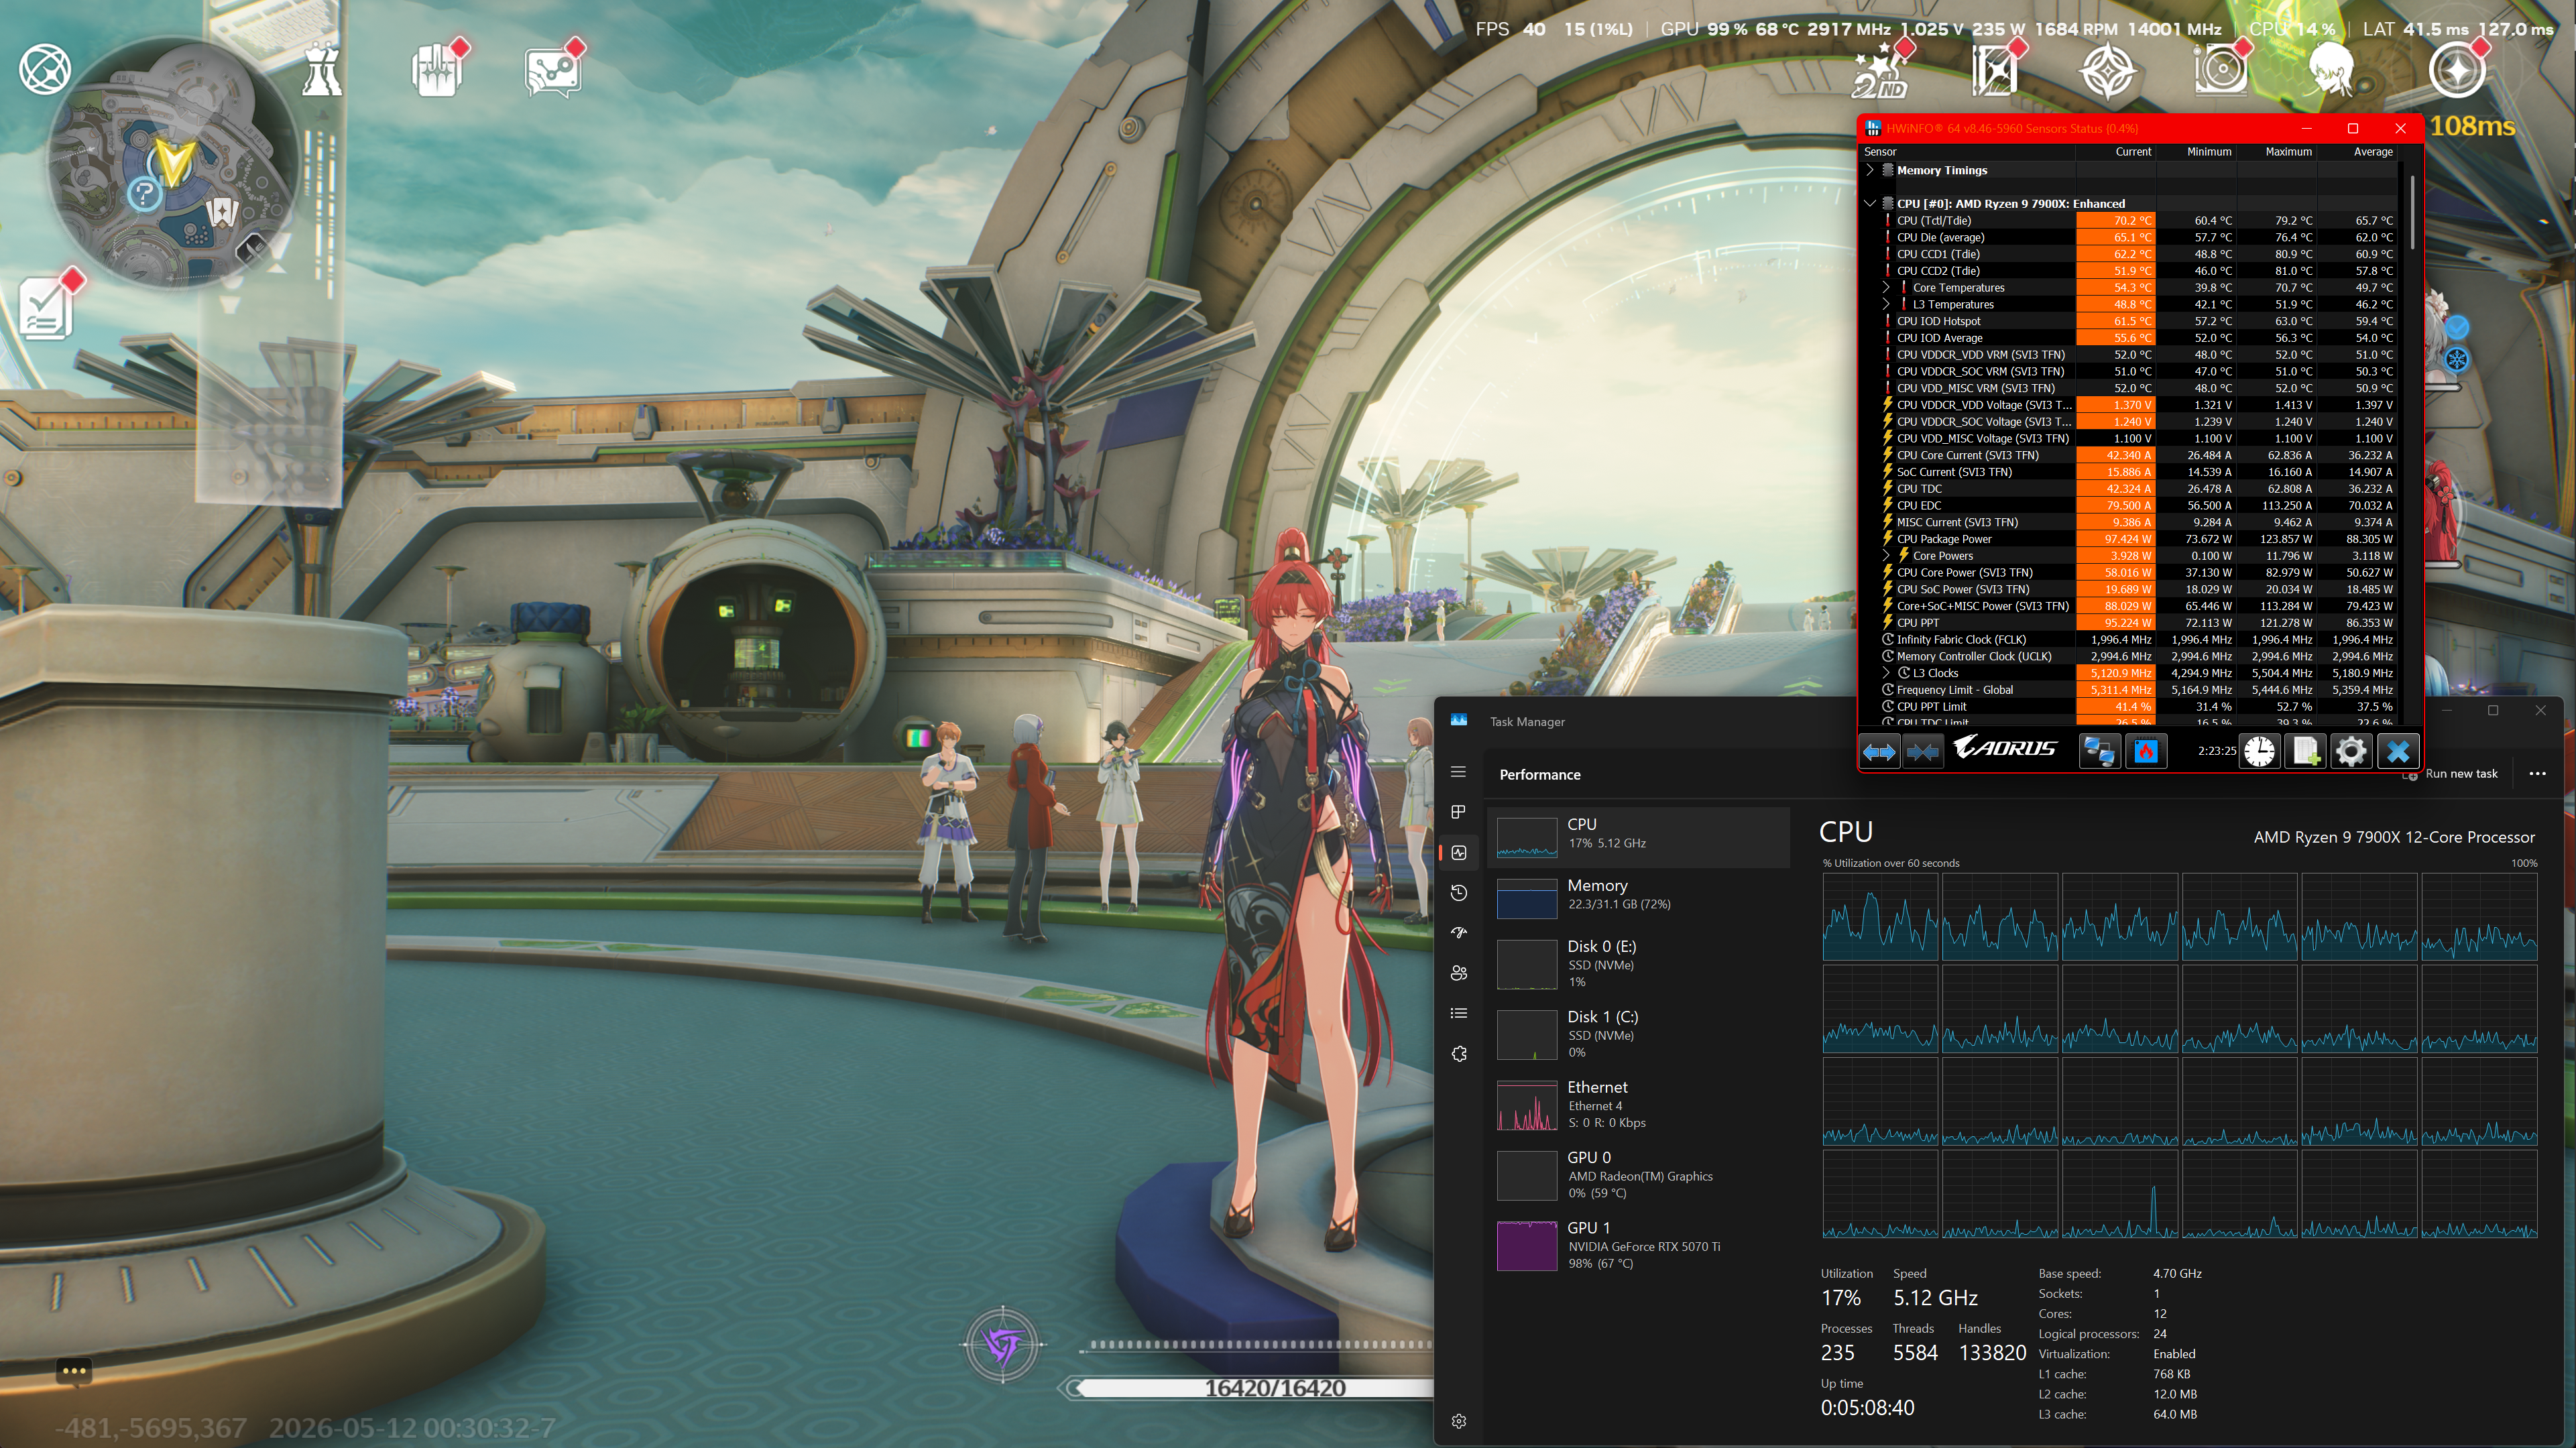
Config B — same settings, daytime
FPS 40 · 1% low 15 · GPU 99% · CPU 17%
Latency spike 127ms visible
Config C — 1024×768 windowed, everything low (crowd density + render distance set high to load CPU), DLSS ultra performance, FG 4x, RT off: FPS 412 · 1% low 200 · GPU 37% · CPU 17% · Latency 26.7ms
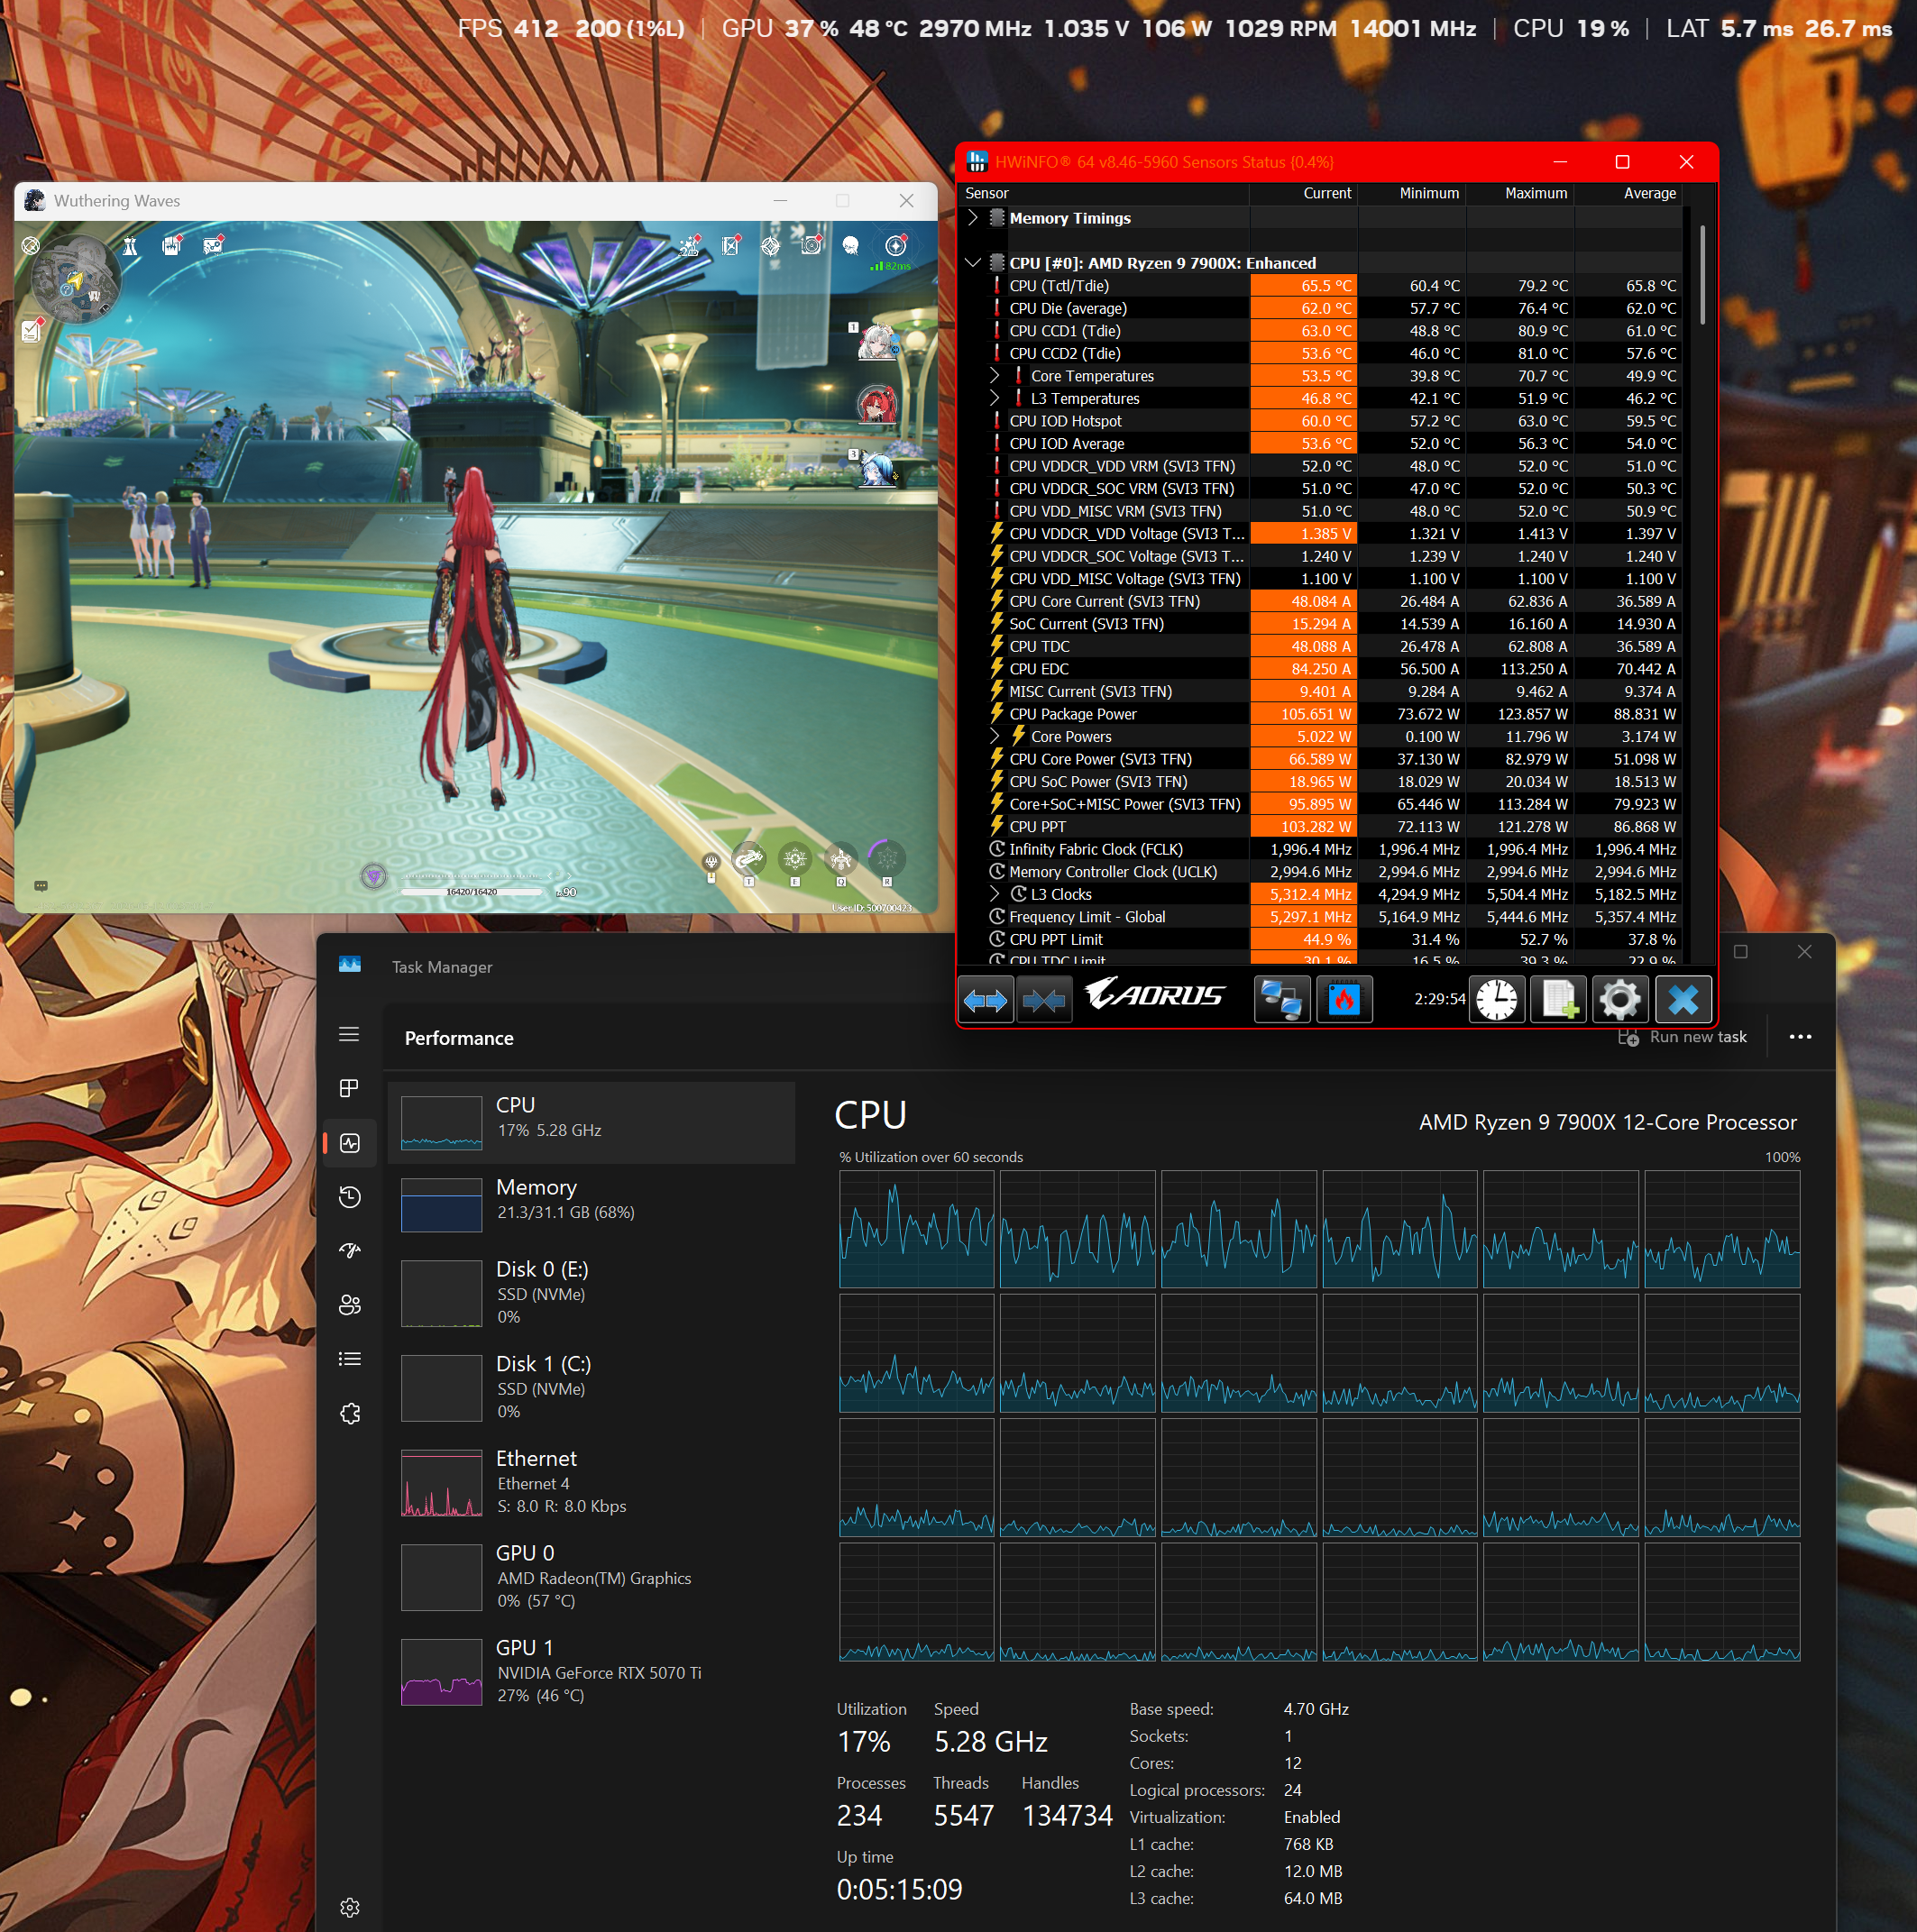
| Config | FPS | 1% Low | GPU% | CPU% | Bottleneck |
|---|---|---|---|---|---|
| A — 4K RT max, Night | 35 | 31 | 99% | 12% | GPU |
| B — 4K RT max, Day | 40 | 15 | 99% | 17% | GPU + Pattern B spike |
| C — 768p Low, FG 4x | 412 | 200 | 37% | 17% | Neither — Startorch entry zone, pre-stress |
What this controlled set demonstrates:
Config A vs B — identical settings, night vs day. Night produces lower FPS (35 vs 40) but better 1% low (31 vs 15). The 1% low difference is notable, but without a detailed frametime graph from these sessions the cause is ambiguous — it could reflect Pattern B compound spikes, GPU frame time variance between scene complexity levels, or both. GPU is 99% in both sessions, confirming GPU is the primary bottleneck at 4K RT.
Config C — recorded inside Startorch Academy but in a low-density spawn area, before moving into high-NPC-density zones. At 768p with GPU deliberately underloaded, both GPU and GameThread have simultaneous headroom — FPS 412 with clean 1% low 200. This does not represent Startorch peak stress performance.
Config A/B vs Config C together — same CPU, dramatically different frame budgets. The similar overall CPU utilization (~17%) across configs suggests the CPU is not the limiting resource in A/B — much of the frame time is dominated by GPU/RT cost. The CPU may still be present on the coordination path, but it is no longer the visible primary limiter in those 4K RT scenes.
Source: @argon1ut (independent technical analyst)
Author’s 7800X3D Data + @argon1ut 7900X Comparison — L3 Cache, Steady-State Stability, and Outlier Behavior
CapFrameX session recorded in Startorch Academy area, same general settings as the 12700KF baseline sessions. Hardware: Ryzen 7 7800X3D (96MB L3 cache) + RTX 5070, 1080p, max settings, RT, DLAA, no FG.
Additional comparison data provided by @argon1ut: Ryzen 9 7900X + RTX 5070 Ti, 1080p, max settings, DLAA, no FG, no NVIDIA Filters. This is not a strict CPU-isolation test — the GPU, driver/runtime state, shader cache, route, streaming state, and overlay/filter stack differ — but it is valuable as a second high-end Zen 4 reference point for the same Startorch-style stress scenario.
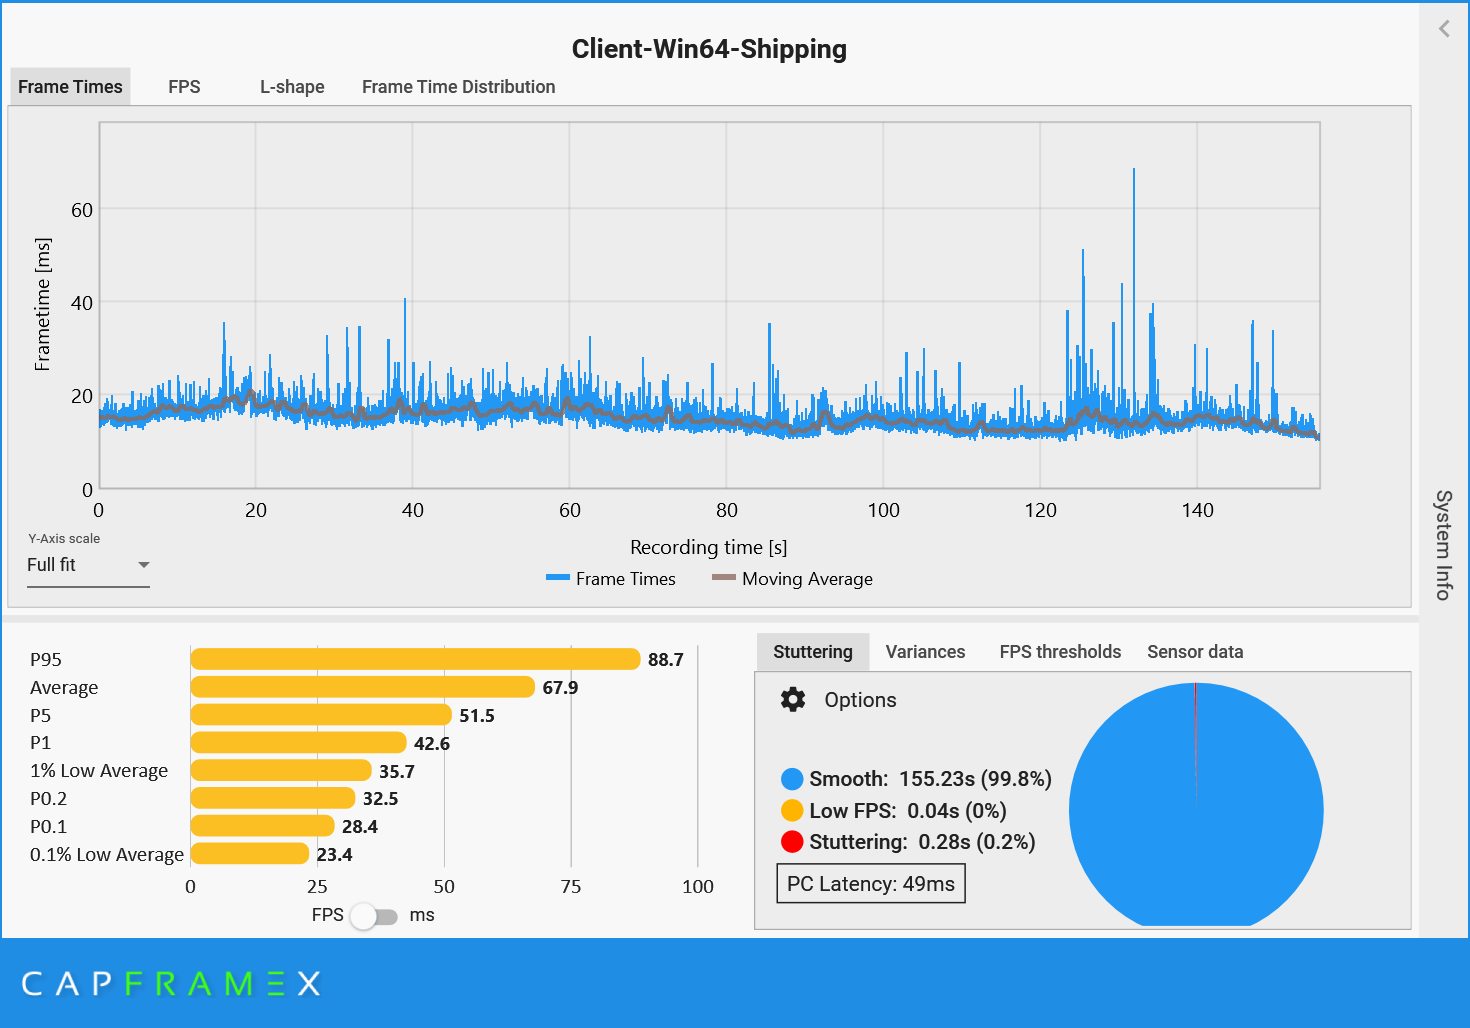
| Metric | 12700KF baseline | 7800X3D + RTX 5070 | 7900X + RTX 5070 Ti (@argon1ut) | Interpretation |
|---|---|---|---|---|
| Avg FPS | 38.5 | 67.3 | 67.9 | X3D and 7900X both massively improve the 12700KF baseline |
| 1% Low Average | 14.8 | 19.2 | 35.7 | 7900X run has the healthier tail in this capture |
| 0.1% Low Average | 9.9 | 5.3 | 23.4 | 7800X3D run is heavily punished by abnormal catastrophic outliers |
| Stuttering | — | 2.66s (2%) | 0.28s (0.2%) | @argon1ut’s run avoids the 300–470ms spike cluster |
| Worst visible spike | 175ms | ~450ms | ~70ms-class visible spikes | Tail behavior depends on more than cache size alone |
Steady-state X3D signal: The 7800X3D capture shows a very clean normal frame-time body before and after the catastrophic spike cluster. This is the part where X3D appears to matter most: cache-sensitive dense traversal, GameThread object traversal, pointer chasing, actor/system coordination, and streaming-management overhead. In this steady-state workload, the 96MB L3 cache helps reduce the cost of scattered UE4 object access and makes Pattern A visibly cleaner.
7900X tail behavior: @argon1ut’s 7900X + 5070 Ti capture has much healthier tail metrics: higher 1% and 0.1% lows, minimal total stutter, and no 300–470ms catastrophic cluster. He also reported that the run felt smooth the entire way. This is an important caveat: modern non-X3D CPUs with strong single-thread performance, high clocks, many cores, and reasonably large modern cache can still provide a smooth and enjoyable WuWa experience. X3D is not the only way for the game to feel good on PC.
Why the 450ms spike should not be over-read: The 7800X3D worst-case spike is not clean CPU evidence. It is suspicious because the run used NVIDIA Filters, while @argon1ut’s run did not. NVIDIA Filters/Freestyle hooks into the render/post-process/driver path and can introduce rare runtime hitches without necessarily lowering average FPS. Streaming state, boundary behavior, shader/material warmup, V8/GC pressure, driver/runtime variance, and overlay/filter behavior can all contribute to the worst outliers. Until the 7800X3D run is retested without NVIDIA Filters, the 300–470ms cluster should be treated as an external or compound-event variable, not as representative of normal X3D behavior.
Pattern B still exists in the healthier run: @argon1ut’s graph still contains visible >70ms-class spikes against a ~15–20ms baseline frame time. They were not necessarily subjectively noticeable, but they show that Pattern B-like variance does not disappear even on a healthy high-end non-X3D run. The difference is severity: his capture shows manageable tail behavior, while the filtered 7800X3D run shows suspicious catastrophic amplification.
The stronger takeaway: X3D is likely the best currently available hardware mitigation for WuWa’s steady-state dense traversal workload — Pattern A — because WuWa appears highly cache-sensitive in areas like Startorch Academy. However, the worst outlier events involve additional systems beyond simple cache locality. X3D does not make WuWa immune to compound hitches; it makes the normal city traversal body much cleaner.
Q: So does WuWa need more CPU cores, or a faster clock?
— Correction credit: @eggsee (WuWa mobile config creator) provided client log evidence confirming WuWa’s TaskGraph thread groups, which informed the more accurate threading model in section 1.1. The original framing of “one singular GameThread lane” was an oversimplification.
An additional contributing factor in dense city areas — mip streaming competition:
Community member @eggsee also identifies a second mechanism contributing to the stutter in areas like Startorch Academy specifically: texture mip streaming competition. Even geometry that is occluded — behind walls, outside the player’s view — still gets streamed in, competing for mip streaming bandwidth with visible content. This clogs the mip streaming pipeline and forces the CPU to spend GameThread budget managing streaming requests for geometry that will never be seen that frame.
On mobile specifically, this compounds with the GameThread coordination overhead to increase GPU frame time simultaneously — which is why CPU and GPU utilization numbers sometimes don’t match expected patterns on mobile traces.
One practical implication: the stutter in a new area often improves after staying there for a while, once shaders are fully compiled and the streaming system has stabilized. This is consistent with a streaming warmup effect rather than a pure static GameThread ceiling — the ceiling is real, but its severity varies with streaming state.
The answer is more nuanced than either. Raw clock speed and IPC (Instructions Per Clock) matter, but for WuWa specifically the most impactful CPU upgrade is often a large L3 cache — and the reason comes directly from the architecture problem described in section 1.3.
In short: the GameThread’s work involves constantly accessing data scattered across RAM. A larger L3 cache keeps more of that data close to the CPU, reducing the stall time on each access. This is why AMD’s X3D CPU — which stack additional L3 cache onto the die — often deliver noticeably smoother WuWa experiences than higher-clocked CPUs with smaller caches, even if their average FPS on paper is lower. A Ryzen 5700X3D may have lower average FPS than an i7-12700KF, but 1% lows and frame consistency in city areas will likely be meaningfully better.
That said: X3D is the best hardware mitigation available, not a cure. It reduces the severity of stutter, but cannot eliminate it — because the root cause is architectural, not a cache size problem that can be fully patched with hardware. The GameThread ceiling, the V8 GC pauses, the OOP pointer-chasing — those all remain. A larger cache makes them hurt less, not disappear.
Practical takeaway: if WuWa stutters and your GPU is below 80% utilization — the upgrade that will help most is a CPU with a large L3 cache, not a new GPU. And calibrate expectations accordingly.
1.3 OOP, Cache Misses, and Why the Engine Fights Itself
There is a deeper problem underneath the GameThread bottleneck. It is not just that everything runs on one thread — it is how that thread accesses data when it runs.
Unreal Engine 4 is built around an Object-Oriented Programming (OOP) model. This is not an informal observation — it is the documented design philosophy of the engine. Epic’s official programming documentation describes UE4 as built around a class hierarchy where UObject is the base for all engine objects and AActor is the base class for everything placeable in a game world, with components attached to actors to define their behavior.
Sources: UE4 Programming Basics · OOP Principles in Unreal Engine
In practice, many gameplay-relevant world entities — NPCs, interactable objects, scripted props, actor-backed effects, and other UObject/AActor-based systems — are represented through UE4’s object hierarchy. Each AActor has a vtable pointer, owns a list of UComponent objects, and those components are heap-allocated individually, sitting wherever the memory allocator placed them at creation time. Static geometry, foliage, HISM/HLOD instances, and other renderer-facing assets can follow different paths; the point here is the gameplay-critical object graph, not every visible triangle in the world.
In simple terms: many gameplay objects live in their own corners of RAM. To update them, the CPU has to go find them.
Imagine the GameThread needs to process logic ticks for a large number of active actors in a single frame — NPCs with behavior trees, buildings with interaction handlers, physics props, particle systems — which happens constantly in a scene as dense as Startorch Academy or Septimont City/Ragunna. UE4 does have systems like HISM, HLOD to reduce rendering load, but these don’t reduce the logic tick burden on the GameThread — behavior trees still need to execute, interaction logic still needs to evaluate, scripting ticks still run, regardless of whether the actor is being rendered at full detail or not. The CPU’s work on the GameThread looks like this:
Tick ActorA → follow pointer → find ComponentList → follow pointer → find data
              [CPU fetches from RAM: cache miss]
Tick ActorB → follow pointer → find ComponentList → follow pointer → find data
              [CPU fetches from RAM: different address, cache miss again]
Tick ActorC → [different address again]
Tick ActorD → [different address again]
...10,000 times
Every single actor tick involves pointer-chasing through memory. When the CPU looks for data not already in its L1 or L2 cache, it stalls waiting for main RAM to respond. On a modern CPU, an L1 cache hit costs ~4 cycles. A main memory fetch costs up to ~200 cycles in the worst case — though in practice many accesses hit L2 or L3 rather than going all the way to RAM, and CPUs use prefetching to mitigate some of this. The actual penalty depends on access patterns, data locality, and cache hit rates. Nevertheless, in a scene with thousands of actors updating per frame, the aggregate impact of cache-unfriendly access patterns is real and measurable — the CPU spends meaningful time waiting rather than computing, even if not every access is a worst-case miss.
A note on UE4’s Binned Allocator: UE4’s default memory allocator (Binned/Binned2) is sophisticated — it uses a tiered allocation system that pools objects by size class and is designed to maximize L1/L2 cache utilization for individual allocations. This meaningfully reduces heap fragmentation and improves per-allocation cache behavior compared to naive allocators. However, it does not connect cache lines between different actors — the pointer-chasing traversal pattern described above persists regardless of allocator strategy, because actors that need to be processed together are not guaranteed to be co-located in memory. The allocator mitigates the problem at the micro-allocation level; the OOP traversal pattern is the macro-level issue. — Clarification credit: @aizen76 (Indie-us Games, UE specialist)
A note on Actor Clustering: UE4 has an Actor Clustering feature, but its function is specific and worth clarifying. Actor Clustering helps skip random-access pointer searches during UE4’s garbage collection pass — reducing GC-induced cache miss overhead. It is not a Tick cache locality system and does not improve the per-frame logic tick access pattern described above. Its benefit is therefore more relevant to GC-related pauses (Pattern B territory) than to the per-frame logic processing bottleneck (Pattern A). — Clarification credit: @aizen76
A useful mental model: imagine a librarian who needs to look up 10,000 books. In a well-organized library (DOD/ECS), books on the same topic are shelved together — she grabs one section and works through it sequentially. In UE4’s model, each book was shelved wherever it happened to fit when it arrived. She walks across the entire building for every single book. The reading is the same amount of work. The walking is what kills performance.
The L3 cache is a small room next to her desk where she keeps recently-used books nearby. A bigger room (more L3 cache) means fewer trips across the building. This is exactly why X3D processors — with their stacked cache — help specifically with WuWa’s workload where other games don’t see the same benefit.
This is exactly why a large L3 cache matters more for WuWa than raw clock speed. The L3 cache acts as a buffer between the CPU cores and main RAM — the larger it is, the more actor data can sit nearby instead of requiring a full round-trip to RAM. A processor with a 96MB L3 cache (like AMD’s X3D lineup) can keep far more of WuWa’s scattered actor data resident than a processor with 20MB or 30MB, even if the smaller-cache CPU has higher clock speeds. The result in practice: lower average FPS on benchmarks, but meaningfully better 1% lows and frame consistency in city areas — which is exactly where the problem lives.
This is not a problem Kuro introduced. It is a structural consequence of how UE4’s object model works. The engine was designed this way, and there is no mechanism within UE4 to change it without rebuilding the entity system from scratch. A developer in the Unreal Engine community forum observed this limitation directly back in 2018:
“For large scale entity simulation, UE4 will likely not be a great tool choice here. As far as I can tell, none of the large engines are particularly well suited for that type of large scale simulation though.”
Source: https://www.reddit.com/r/unrealengine/comments/9uzkpk/
That last clause — none of the large engines — was accurate at the time. Since then, two studios have changed the equation — not by choosing a better engine, but by investing heavily enough to transform the one they had.
Why Genshin Impact and Arknights Endfield Feel Different
The Genshin comparison comes up constantly in this community, and it is worth addressing properly rather than dismissing.
Genshin Impact runs on Unity. But the reason Genshin handles entity density more gracefully is not “Unity is better than UE4” — it is the result of HoYoverse committing a decade of R&D investment into a heavily customized engine that bears the name Unity but operates very differently from the stock version any other studio would ship.
HoYoverse’s previous major title, Honkai Impact 3rd, was built on Unity and ran for years at scale. That experience gave them two things Kuro didn’t have when starting WuWa: a team with deep Unity expertise, and years to understand how to push Unity’s architecture toward data-oriented patterns before the hard limits became visible. By the time Genshin launched, they were not shipping Unity — they were shipping HoYoverse’s Unity, a heavily modified engine reflecting a decade of institutional investment in custom systems, tooling, and DOD-oriented architecture.
Similarly, Arknights Endfield is not a stock Unity game — Hypergryph has invested substantially in customizing their Unity pipeline. They benefit from being able to leverage official DOTS/ECS infrastructure (which Unity only shipped for production use from 2022 onward) while also building on their own engine expertise.
The key point: the credit belongs to Hoyo and Hypergryph’s engineering investment, not to Unity as a product. A studio shipping stock Unity today would not automatically achieve Genshin’s entity handling. Stock Unity is also OOP-heavy in its classic form. The performance characteristics we observe in these titles are the result of what those studios built on top of the engine — not the engine itself.
Unity’s component-based design is architecturally closer to DOD than UE4’s inheritance-heavy AActor model — it is a more favorable starting point. But “more favorable starting point” and “better engine” are not the same thing. The distance between stock Unity and what Genshin actually runs on is enormous, and that distance represents years of engineering work that no other studio can simply acquire by choosing Unity.
OOP approach (UE4 AActor):
  Actor_A.Position → address 0x1A3F00  (somewhere in heap)
  Actor_B.Position → address 0x7C2104  (completely different location)
  Actor_C.Position → address 0x4E8830  (different again)
  → CPU cache: evicted and refilled on every single actor tick

DOD/ECS approach (Unity DOTS / custom):
  PositionArray: [ A.pos | B.pos | C.pos | D.pos | E.pos | ... ]
                   ↑ single contiguous memory block
  → CPU loads one cache line, processes several entities, moves to next
  → Cache stays warm for the entire batch
Note: The memory addresses above (0x1A3F00, etc.) are illustrative examples only, not actual values from any real process.
Source: https://unity.com/ecs
Unity’s C# Job System makes the thread-safety implications of this data layout explicit. From Unity’s own documentation:
“To make it easier to write multithreaded code, the Unity C# Job System detects all potential race conditions and protects you from the bugs they can cause.” “The C# Job System solves this by sending each job a copy of the data it needs to operate on, rather than a reference to the data in the main thread.”
Source: https://docs.unity3d.com/2020.1/Documentation/Manual/JobSystemSafetySystem.html
This is the architectural reason why Unity’s Job System can safely dispatch work to worker threads. UE4’s AActor graph has no equivalent — actors share references, making safe multi-threading on arbitrary game logic nearly impossible without architectural surgery. But accessing this capability in a game like Genshin required Hoyo to build much of the infrastructure themselves before official support existed.
An honest caveat: Genshin has a significantly lower visual ceiling than WuWa. The trade runs both ways. DOD-friendly architecture comes with real constraints on content authoring and system interaction. And Hoyo had years of prior work and institutional runway that Kuro simply did not have when starting WuWa on a new engine with a new team.
There is no ECS or DOD framework in UE4. Unreal Engine 5 does improve the threading situation somewhat — Mass Entity offers limited large-scale entity simulation support — but the fundamental OOP heritage remains deeply embedded. WuWa predates UE5 and is not built on it.
2. The Scripting Layer and Its Costs
2.1 What Puerts Is and Why It Exists Here
Somewhere between UE4’s C++ foundation and the gameplay logic you interact with, WuWa has a scripting layer. This is no longer a matter of inference — it is confirmed by direct evidence from the game’s own runtime logs and binary.
Direct evidence — runtime logs:
WuWa writes diagnostic output to Client\Saved\Logs\Client.log on every launch. The following entries appear consistently across multiple log backups (Client-backup-*.log), ruling out a one-time fluke:
[Client.log line 2564]  启动v8 V8ThreadHelper
[Client.log line 2565]  PuertsJsEnv: ... v8 version: header-11.8.172.18, lib-11.8.172.18
[Client.log line 2566]  LoadModule: Puerts
The game is explicitly initializing a V8 thread helper, loading the Puerts module, and reporting its V8 version at startup. This is as direct as runtime evidence gets without a full profiler.
Direct evidence — binary strings:
String extraction from Client\Binaries\Win64\Client-Win64-Shipping.exe yields the following identifiers embedded in the binary:
Puerts
PuertsJsEnv
typescript
TypeScriptGeneratedClass
KuroPuerts
puerts/*.js
/Game/Aki/TypeScript/...   (multiple paths)
The KuroPuerts identifier in particular suggests a Kuro-specific fork or customization of the Puerts framework, not a stock integration.
Datamined configuration evidence:
This is consistent with what the Arikatsu/WutheringWaves_Data repository shows in terms of content pipeline structure:
BinData/level_entity/          ← legacy TypeScript path (present v1.0 onward)
BinData/prefab/                ← legacy TypeScript path (present v1.0 onward)
BinData/level_entity_csharp/   ← new C# path (first appears v2.8)
BinData/prefab_csharp/         ← new C# path (first appears v3.0)
And confirmed in aki_base.csv, the game’s master database manifest:
v1.0 through v2.7:  zero entries mentioning "csharp"

v2.8:  LevelEntityForCSharpConfig,  db_level_entity_csharp.db   ← first migration signal
v3.0:  PrefabForCSharpConfig,       db_prefab_csharp.db         ← expanded to prefab system
v3.1–v3.2:  same two entries, infrastructure stable
On accessing pak contents:
While Kuro rotates AES keys per release, the community project at https://github.com/ClostroOffi/wuwa-aes-archive maintains an updated archive of keys across versions, making pak content accessible via tools like FModel. Inspection of unpacked assets through this pipeline reveals the ScriptAssemblies directory under Client/Content/Aki/, containing C# runtime assemblies including CSharpScript.dll, Microsoft.CSharp.dll, mscorlib.dll, and numerous System.* assemblies — confirming the C# runtime environment is fully deployed alongside the TypeScript/Puerts layer.
The directories exist. The database entries exist. The log entries confirm active use at runtime. The Puerts/V8 claim is no longer circumstantial — it is directly confirmed.
Q: Why did Kuro choose a TypeScript scripting layer if it affects performance?
Because at the time WuWa’s development was getting started, the priority was development velocity, and a scripting VM layer delivers exactly that.
Kuro’s previous major project was Punishing: Gray Raven — built on Unity, not UE4. Shifting to Unreal Engine for WuWa meant the team was already navigating an unfamiliar engine. A scripting layer like Puerts addresses a real practical problem: game designers and gameplay engineers can write and iterate on logic in TypeScript without touching C++ or rebuilding the engine. This matters more than it sounds — native C++ development means recompiling the entire source tree for every debug iteration or new function implementation, which is extremely time-consuming on a large project. Hot reload works. Iteration cycles are shorter. The cost is runtime performance at scale — but that cost is invisible early in development when the game is small.
This is the classic live-service bootstrap tradeoff: buy development velocity now, pay the performance cost later. The engineering team almost certainly understood the risk — a scripting VM accumulating GC pressure at scale is not an obscure edge case. But when velocity is non-negotiable and the alternative is slower iteration on an unfamiliar engine, this tradeoff becomes a forced choice, not a mistake. The debt was knowingly taken on. The migration is the repayment.
2.2 The V8 GC Problem — and Pattern B
V8 has two garbage collectors running in tandem. The Minor GC (Scavenger) handles short-lived objects in the young generation — cheap, frequent, mostly invisible. The problem is the Major GC (Mark-Compact), which runs when long-lived objects have accumulated enough to fill the old generation heap.
The default approach, as V8’s own engineering blog describes it:
“A straight-forward approach is to pause JavaScript execution and perform each of these tasks in sequence on the main thread. This can cause jank and latency issues on the main thread, as well as reduced program throughput.”
Source: https://v8.dev/blog/trash-talk
The blog also identifies the specific scenario that makes major GC expensive — exactly the scenario WuWa creates when transitioning from a dense area to open world:
“One potential weakness of a garbage collector which copies surviving objects is that when we allocate a lot of long-living objects, we pay a high cost to copy these objects.”
Source: https://v8.dev/blog/trash-talk
In Startorch Academy or Septimont, JavaScript objects are being created constantly: NPC behavior trees, quest trigger states, building interaction handlers, UI update callbacks. Many survive long enough to be promoted to the old generation heap. When the player leaves the area, those objects become unreachable — but V8 doesn’t know that until the major GC runs.
Think of V8’s garbage collector like a cleaning crew that only comes when called — but when they arrive, they lock the entire building until they’re done. While you’re inside Startorch Academy, clutter accumulates everywhere (an object created for every NPC tick, every quest state update, every interaction). When you walk out, the crew decides now is the time to clean. Everything freezes until they finish, then resumes normally.
The v3.1 streaming update improved how quickly the building empties out when you leave. It didn’t change how the cleaning crew operates. The TS→C# migration is what replaces the cleaning crew itself with one that works incrementally — no lockout required.
This is the mechanism behind Pattern B — the hard freeze when leaving a city or when a large volume of geometry is unloaded at once. The trigger is not limited to city boundaries specifically; any transition where a large pak unload and accumulated GC pressure coincide can produce the same event. Dense city exits are just the most consistent and predictable trigger. It is a compound event:
Player crosses city boundary
        │
        ├─► UE4 asset streaming: unload city pak data
        │   Memory deallocation, I/O flush
        │   → Streaming spike
        │
        └─► V8 major GC: heap has been filling
            during entire city visit
            → Stop-the-world pause fires at transition

Both simultaneously → visible hitch; in severe or older-version cases, players could perceive this as a 0 FPS freeze lasting 500ms–2s

An additional contributing factor during boundary transitions is **on-demand shader compilation**. In open-world games, shaders are frequently compiled on first encounter with new materials or effects — and boundary transitions often introduce new asset types requiring new shader variants. When shader compilation coincides with streaming flush and GC pressure, it can amplify the compound event further. The severity is highly hardware-dependent: systems with stronger single-thread CPU performance and larger caches resolve shader work faster, reducing visible impact.
Modern V8 (the “Orinoco” collector) has improved this with concurrent collection, but acknowledges the limits:
“The advantage here is that the main thread is totally free to execute JavaScript — although there is minor overhead due to some synchronization with helper threads.”
Source: https://v8.dev/blog/trash-talk
Even with Orinoco, the major GC cycle cannot be fully offloaded. In a game engine where the GameThread is already under city load, the compound timing of streaming flush and GC cycle is what produced the severe 0 FPS freezes that long-time players remember.
Why Pattern B has improved but not disappeared: Kuro’s v3.1 streaming pipeline update (“updated the loading pipeline and accelerating data streaming”) addressed the asset streaming component of the compound event. The GC component remains — because that requires migrating the scripting layer away from V8, which is precisely what the TS→C# migration targets. The partial improvement is exactly what you would expect from fixing one of two concurrent causes.
This is the spike that appears with no corresponding GPU load change, no temperature change, nothing on screen to explain it.
I have two benchmark captures that together tell this story clearly.
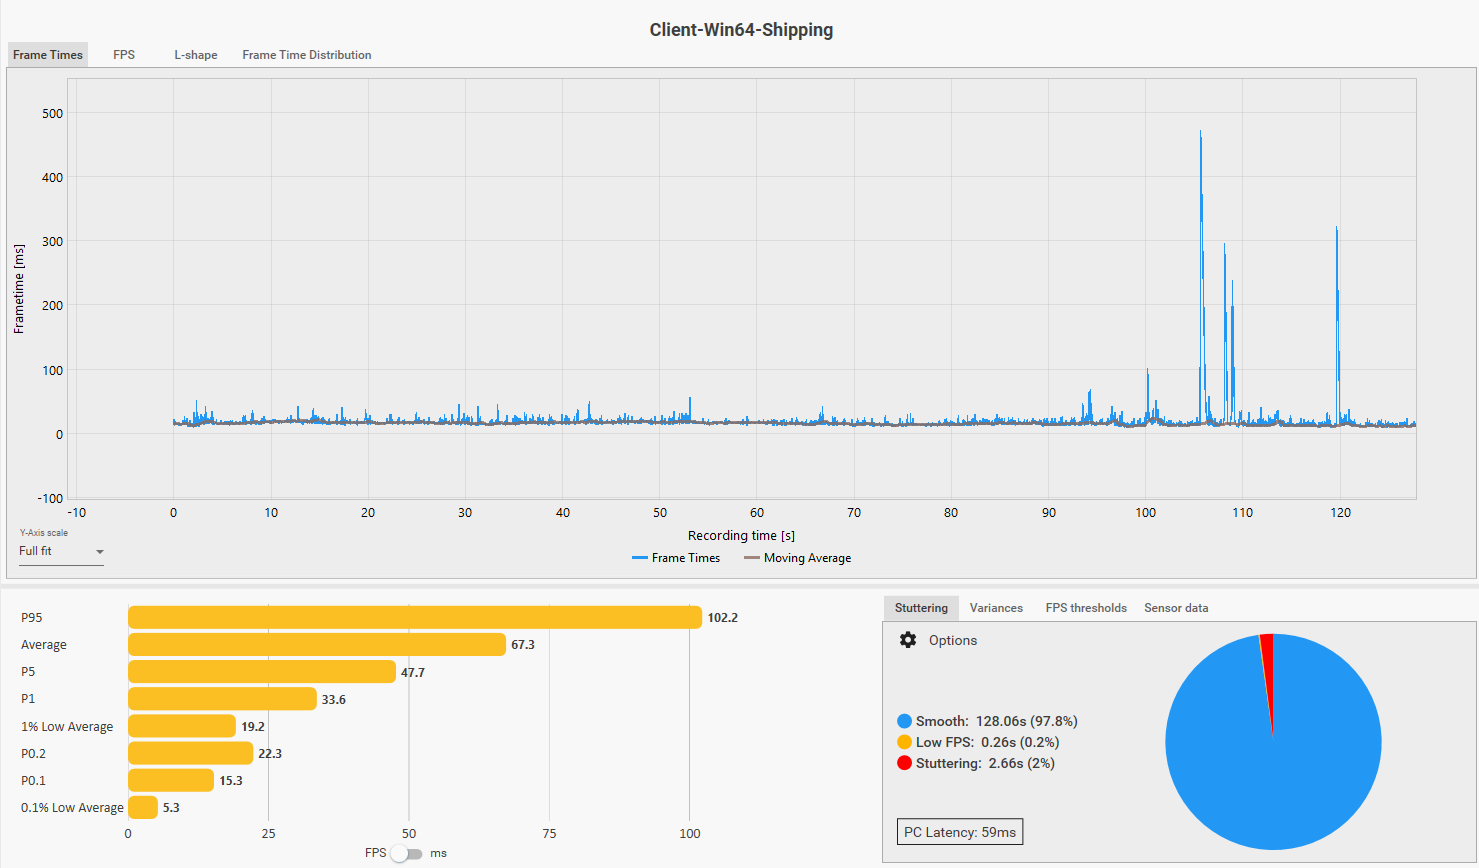
Startorch Academy session — traversal including a motorbike exit from the academy toward the open world. Worst single frame: 175ms, against a P99.9 of 77ms. That outlier sits far outside the normal distribution tail. At 58% average GPU utilization, the GPU was not the source of a 175ms pause. The profile is consistent with a V8 major GC stop-the-world cycle firing at the area transition.
Huanglong session — same hardware, same settings. During this session, I deliberately flew out of the city boundary at maximum speed using the glider. Worst single frame: 245ms. This was not an organic stutter — it was a controlled trigger of Pattern B. The faster and more abrupt the boundary crossing, the more severe the compound event: streaming flush and GC fire simultaneously with less time between them to stagger the load.
The two numbers together are useful. 175ms organic (Startorch) vs 245ms deliberate rapid exit (Huanglong) shows both the floor and the ceiling of Pattern B severity. Normal traversal produces the 175ms case. Aggressive boundary crossing produces the 245ms case. Earlier versions of the game, before v3.1’s streaming pipeline improvements, likely produced even higher values because the streaming flush component was larger.
Caveat on both spikes: I cannot confirm these are V8 GC events without scripting VM profiler access. The pause profile, magnitude, and absence of GPU correlation are consistent with V8 major GC behavior. I am calling this inferred, not confirmed.
2.3 The Migration and What It Actually Fixes
The TS→C# migration is not a performance patch. It is an architectural foundation change.
Modern managed runtimes can use incremental, concurrent GC modes that significantly reduce pause severity compared with V8 major GC in this workload — depending on runtime configuration, worst-case pauses can drop from hundreds of milliseconds to single digits. C# does have stop-the-world phases in some configurations, but the migration path from V8’s mark-compact behavior toward a tunable managed runtime represents meaningful progress on Pattern B regardless of the specific implementation Kuro adopts.
What the migration does not fix: the GameThread single-thread ceiling. UE4’s threading architecture will still serialize much of the gameplay-critical coordination path through the GameThread. Even after a complete migration, WuWa will still hit the same UE4 scalability wall in dense scenes.
What the migration does fix: removes the scripting VM’s contribution to the worst-case frame time spikes. The 175ms outlier events — those can become dramatically less severe, and in some cases may disappear entirely if the scripting VM contribution is the dominant component.
| TypeScript (V8) | C# (managed runtime) | |
|---|---|---|
| GC model | Stop-the-world major cycles | Incremental, concurrent |
| Worst-case GC pause | 100–500ms | Often dramatically lower; sometimes single-digit ms depending on runtime configuration and workload |
| Per-patch debt growth | Accumulates (every new system adds heap pressure) | Substantially reduced |
| Interop with UE4 | Through V8 bridge | More direct |
The migration also compounds. Every new content system built on the C# path costs less in GC pressure than it would have on V8. The ROI grows with every patch. This is why the migration is worth doing during an active live-service cycle even though players will never see it on a patch note.
The project scale data from the datamine illustrates what they were up against:
| Version | Total files | BinData dirs |
|---|---|---|
| v1.0 | 1,264 | 228 |
| v2.0 | 1,442 | 266 |
| v2.7 | 1,903 | 337 |
| v3.2 | 2,292 | 402 |
The content database grew 81% from launch before the C# migration infrastructure was even scaffolded. Every entity, quest trigger, and prefab added during that period ran through the V8 path. The migration is catching up to nearly three years of accumulated scripting debt.
On scripting layers as amplifiers, not root cause
Unreal Engine has always supported high-level scripting systems — from UnrealScript in earlier versions to Blueprint in UE4. These systems operate within the same fundamental execution model, with gameplay logic ultimately coordinated through the GameThread.
The presence of Puerts and V8 in WuWa indicates an additional scripting layer enabling JavaScript-based gameplay logic alongside native systems. This introduces overhead: increased execution cost compared to native C++, cross-language interaction, memory management including GC, and additional synchronization points.
However, it is critical to distinguish between cause and amplification. The underlying coordination bottleneck exists independently of the scripting layer. Scripting systems — whether Blueprint, UnrealScript, or V8 — operate within the same architectural constraints. Their impact is to increase the amount of work that must pass through the coordination point, thereby making the bottleneck more visible or more frequently exceeded.
The scripting layer does not create the bottleneck — it contributes to how heavily it is stressed. Replacing one scripting system with another does not remove the constraint; it only changes the cost of operating within it.
This is why the TS→C# migration reduces Pattern B severity but cannot address Pattern A. The bottleneck exists at the architectural level. The scripting system only changes the rate at which it is saturated.
— @argon1ut
Why not simply rework the threading model?
In theory, it is possible to address these limitations by significantly reworking UE4’s threading model. In practice, doing so approaches the scope of building a new engine.
The coordination model in UE4 is deeply integrated into core systems — gameplay execution, rendering, scripting, and engine APIs are all built around it. Altering this structure would require extensive changes across the engine’s foundation, introducing substantial complexity, cost, and risk.
At that point, the question shifts from “can this be changed?” to “is it more practical to modify the existing engine, or to build a new one?” Developing a new engine offers greater architectural freedom, but comes with significant upfront engineering cost, long development timelines, and a strategic requirement that the new engine be broadly reusable across future projects to justify its cost. Studios must evaluate whether their future titles will consistently benefit from such an investment. As a result, most studios opt to work within the constraints of existing engines, incrementally improving performance rather than undertaking a full architectural rewrite.
— @argon1ut
3. The Context: What Other Games Tell Us
3.1 Hogwarts Legacy: The Same Disease, Different Patient
If you want to understand whether WuWa’s stutter problems are a Kuro problem or a UE4 problem, Hogwarts Legacy is the cleanest data point available.
It runs on UE 4.27. It was made by Avalanche Software with a Warner Bros. budget. And it shipped with some of the most documented PC performance issues of any recent major release — the pattern identical to WuWa:
- CPU-bound specifically in dense areas (Hogsmeade, populated castle sections) while open areas run fine
- GPU underutilized relative to the stutter being experienced
- Single-core CPU frequency matters; adding more cores does not help
A player with a Ryzen 9 5900X and RTX 4090 — one of the stronger gaming setups available — documented the problem directly in a Steam thread:
“5900x with 4090 here. I’m gaming at 4K. If I don’t use frame generation, I can hit 90–99% GPU utilization with 30–40% CPU utilization but the framerate is trash (50fps to 70fps).”
Source: https://steamcommunity.com/app/990080/discussions/0/3824161508141330042/
High GPU load, middling CPU overall load, bad framerate. The same shape as WuWa’s profile. And from a different thread, someone who had figured out the actual cause:
“Its only CPU limited because the engine doesn’t scale to more than a core or 2 so a CPU with more cores isn’t going to help, its single core performance (IPC) it wants and needs. If the engine scaled to 8 cores we wouldn’t see a CPU limitation.”
Source: https://steamcommunity.com/app/990080/discussions/0/3789254716328881575/
That second quote comes from a player — not a developer — who arrived at the correct technical diagnosis through observation. It describes UE4’s GameThread architecture more accurately than most technical write-ups.
This is not coincidence. It is the same engine, the same threading model, the same single-thread ceiling — on a project with far greater resources than WuWa had at launch. The lesson is not that Kuro failed to solve a problem other studios successfully solved. No clearly comparable UE4 open-world live-service title has publicly demonstrated a complete escape from this pattern.
Q: So why did Kuro choose UE4 if it has these limitations?
Because they wanted to build a next-generation gacha game, and in 2019–2020, UE4 was the most practical foundation for that ambition. UE5 did not yet exist. Unity’s DOTS/ECS was not production-stable at this scale. Building a custom engine from scratch — as CD Projekt did with REDEngine, or Rockstar with RAGE — requires years of dedicated R&D that simply wasn’t available.
UE4 offered mature tooling, a large hiring pool, and enough flexibility to be pushed hard. And to Kuro’s credit, the version of UE4 they shipped is not a stock build — it incorporates a custom Lumen-inspired GI system built by investigating and reconstructing parts of Lumen’s hardware RT approach within UE4.26. This was presented officially by Wang Xin (Kuro Games rendering team lead) at Unreal Fest Tokyo 2025, hosted by Epic Games Japan. The presentation explains that Kuro analyzed Lumen’s hardware RT implementation — Screen Probe Gather, Radiance Cache, Reflections — and reconstructed portions of it in UE4.26. Critically, core elements could not be directly ported: “The UE5 version of Lumen uses a Surface Cache that retains the radiance of the object’s surface, but this cannot be used directly in UE4.26, so Narushio has omitted the porting work.” Instead, Kuro implemented a custom Clipmap Irradiance Cache as an approximate alternative, alongside probe-based, SH-compressed, and cached approximation techniques throughout. The result is a Lumen-inspired system that approximates similar lighting goals — not UE5 Lumen running in UE4. (Source: 4Gamer.net) That kind of investigative and reconstructive work doesn’t happen by accident. The team that shipped WuWa understood Unreal well enough to build a custom GI system by studying and partially reconstructing UE5’s approach.
The same presentation also confirmed the UE5 migration barrier directly, in Kuro’s own words: “Since Narushio is a long-running title that has already been released, stability is paramount. From the start of the project, a vast amount of assets were created with UE4 in mind, making it difficult to migrate to UE5 at this point.” This is the architectural lock-in this analysis describes — not speculation, but Kuro’s own engineering team explaining why migration isn’t happening.
What was harder to foresee was how badly these specific limitations would surface at WuWa’s scale. In 2020 when development began, open-world UE4 games with comparable ambition were scarce — Tower of Fantasy had just released in 2021, Hogwarts Legacy in 2023. The full picture of what this engine pattern costs in a live-service open-world context at this visual fidelity wasn’t visible yet. Nobody had walked this exact road before. In hindsight the technical debt is clear. At the time it was much less so.
Looking forward, the same presentation noted Kuro’s research direction: “processing scenes with complex geometry using Mega Geometry technology like Nanite.” This is not a Nanite port — they are explicitly researching solutions in that direction. Combined with the custom Lumen-inspired GI work already shipped, this confirms a consistent pattern: Kuro identifies UE5 capabilities that address specific bottlenecks, then reconstructs or selectively adapts comparable techniques inside their UE4.26 build rather than migrating the entire engine.
3.2 Gears 5 and Fortnite: The UE4 Exceptions (And Why They Don’t Apply)
Gears 5, made by The Coalition, is frequently cited as the best UE4 implementation. It runs at locked 60fps on consoles, scales cleanly to PC, and has smooth frame times. The reason is directly relevant: it is not an open world. Linear level design allows aggressive pre-baked culling. There is no streaming complexity, no unpredictable actor density, no live-service accumulation. The Coalition designed around UE4’s constraints for a game type that fits them naturally.
Fortnite deserves a mention here as the other commonly cited UE4 exception — and it is genuinely exceptional, because it is made by Epic Games themselves, the developers of Unreal. Having direct access to the engine team, the ability to modify the engine at any depth on any timeline, and institutional knowledge that no external studio can match produces a different class of result. Fortnite is also not an open-world game in the sense WuWa is — its dense city areas and match structure are architecturally different from a persistent open world with thousands of simultaneously ticking actors. But even acknowledging those differences, it is worth noting that the smoothest UE4 experience available comes from the engine’s own creators.
WuWa is neither of these. The game type won’t allow Gears 5’s approach, and Kuro doesn’t have Epic’s internal access.
3.3 Cyberpunk 2077 and RDR2: When People Compare Apples to Custom Engines
Another common community comparison goes like this: “Cyberpunk 2077, Red Dead Redemption 2 looks incredible and runs really stable. Why does WuWa struggle at stuttering?” It is worth addressing this directly, because the comparison fundamentally misunderstands what is being compared.
REDEngine 4 (Cyberpunk) and RAGE (RDR2) do not have the same GameThread problem because they were not built with UE4’s design philosophy — or UE4 at all.
CD Projekt redesigned REDEngine specifically for open-world streaming. Its job system is native to the architecture, not bolted on. Draw call submission distributes across threads. The entity component system was built for this use case from scratch.
RAGE has over twenty years of iteration specifically for dense open-world environments. Rockstar’s streaming system anticipates geometry before the camera reaches it. Memory layout was designed for cache coherency long before the term “data-oriented design” became mainstream.
Comparing WuWa’s frame times to these games is not a fair performance comparison. It is a comparison between a general-purpose engine used for a demanding use case, and custom infrastructure built specifically to handle that use case over many years. Different tools, different constraints, different histories.
4. What Kuro Is Actually Doing
4.1 Patch Performance Improvements
Every patch note that mentions performance optimization is a payment against the technical debt balance. Looking at the official patch notes from v1.2 through v3.2, a pattern emerges — not just that Kuro is working on performance, but what kind of work is being done and how that evolves over time.
The early patches focused on surface-level stability:
v1.2 — “Optimized game performance for select mobile devices.” Targeted, device-specific. No architectural change.
v1.4 — Optimized shader compilation on PC; moved it to title screen to reduce visual glitches during gameplay. Added Auto FPS for Android to prevent overheating. This patch is notable because it addresses one of UE4’s most notorious pain points — in-game shader compilation — and pushes it out of the main gameplay loop.
The middle era (v2.x) shows scope expanding:
v2.0 — “Optimized CPU usage for NPCs, allowing more NPCs to appear on the screen at the same time.” This is a direct GameThread optimization. Kuro is explicitly acknowledging that NPC density has a CPU cost, not a GPU cost — and working on it.
v2.2 — “Optimized the efficiency of the shader compilation process and the hardware resource usage on PC.” Second pass on the shader problem.
v2.8 — The most substantive performance patch in the dataset:
- “GPU load from Ray Tracing and increased frame rates will be reduced”
- “Memory and VRAM usage will be reduced when various types of scenes are being displayed”
Two separate categories of improvement in one patch — rendering overhead and memory pressure simultaneously. This is not a surface fix.
The mechanism behind this RT improvement was later revealed at Unreal Fest Tokyo 2025: Kuro’s rendering team fixed CPU-side RT bottlenecks in the RHI thread — Gather Instances (3.2ms), Build Acceleration Structure (2.8ms), and Bind SBT (2.4ms). They split static and dynamic work, ran Gather Instances on a separate thread, and pre-executed static portions of Build Acceleration Structure and Bind SBT earlier in the frame. Result: frame time with RT dropped from 19.8ms → 10.5ms. This is an RHI thread fix, not a GameThread fix — as @argon1ut noted. It explains why RT overhead improved that patch cycle while Pattern A city stutter remained unchanged.
v3.1 — “Optimized the game’s resource loading performance by updating the loading pipeline and accelerating data streaming, to help reduce loading stutter on some PC/mobile devices with lower specs.” Direct address of loading stutter — the symptom category that asset streaming problems produce.
v3.3 (April 30, 2026) — Introduced self-developed mobile frame generation targeting mid-range devices. This is significant in two directions: it demonstrates continued investment in mobile performance infrastructure, and it is an implicit acknowledgment that the GameThread ceiling on mobile is not being solved at the architectural level in this patch cycle — frame generation is being used to compensate for frame rate limitations rather than reduce them at source. Also added DLAA and Anisotropic Filtering options on PC. Resource Cleanup on mobile now allows removing map environment resources, and Basic Resources package size was reduced — incremental progress on the storage footprint discussed in the previous memory bloat analysis.
The trajectory is meaningful: from device-specific tweaks in 1.x, to CPU/NPC optimization in 2.0, to RT overhead and memory reduction in 2.8, to streaming pipeline improvements in 3.1. Each payment is incremental. None of it solves the architectural ceiling. But it accumulates.
Two observations worth flagging:
First, v3.1’s streaming pipeline update — “updated the loading pipeline and accelerating data streaming” — is the patch that visibly reduced Pattern B (the hard 0 FPS freeze when leaving cities). Players who have been with the game since 2024 will recognize this. The improvement is real and measurable in daily play. What remains is the GC component of that compound event, which the streaming fix could not address.
Second, v2.8 is a milestone in both directions simultaneously: the most substantive performance optimization patch in the dataset, and the version where LevelEntityForCSharpConfig first appears in aki_base.csv. The surface-level optimizations and the architectural migration began in the same patch. They are not sequential — they are parallel tracks.
4.2 The Migration in Context
The TS→C# migration deserves a specific comparison to the other optimization work that could theoretically be done.
Consider CPU-side culling improvements, VFX LOD authoring, or shader precision tuning. Each of these is a real fix for a real problem. None of them require a new engine. And yet none of them have been fully shipped.
The reason is not that Kuro doesn’t know about them. It is that “technically fixable” and “feasible within a live-service release cadence” are different things.
The engineering team is running on a treadmill. Optimizing deeply means stopping to fix the treadmill — but if the treadmill stops, you fall off. The TS→C# migration is the equivalent of replacing the treadmill’s core components one at a time, while still running, without players noticing the machine is being rebuilt underneath them.
Retrofitting VFX LOD for WuWa’s character skill sets, for example, is not an engineering task. It is a content production task: reopen every existing skill VFX — across 50+ characters with 5–6 skills each — author LOD variants, QA each one for visual regressions on content that is already live, train artists on the new workflow, and enforce it for every future release. That work competes directly with the characters, events, and areas that have to ship in the next six-week window to keep the game viable.
The TS→C# migration gets prioritized over these fixes because it is the one change with compounding infrastructure returns. Every future content addition on the C# path carries less GC risk than it would have on V8. The ROI is exponential, not linear. Shader precision tuning has one-time ROI. The migration’s value grows with every patch.
Kuro is doing this migration in addition to maintaining the six-week content schedule. When it works correctly, players don’t notice. That is the nature of infrastructure work.
4.3 MagicDawn: The Longer Term
MagicDawn is Tencent Games’ internal rendering research team. Their published work from 2025–2026 includes:
- Neural Dynamic GI (CVPR 2026): Neural compression for temporal lightmap sets, enabling dynamic global illumination with dramatically reduced storage and compute overhead
- Gaussian Probe Compression (SIGGRAPH 2025): Light probe compression up to 1:50 ratio with real-time GPU decompression
- Lightmap Compression (Eurographics 2026): 83% storage reduction in UV-space lightmaps with PSNR improvements
Source: https://magicdawnlab.github.io/
Importantly, MagicDawn’s own promotional video explicitly states: “MagicDawn is already powering a wide range of blockbuster games including Wuthering Waves” — confirming an active collaboration with Kuro, not merely theoretical research.
Production integration confirmed via Engine.ini: WuWa’s shipping Engine.ini contains the following plugin path:
Paths=../../../Engine/Plugins/MagicDawn/Content
This is direct evidence that MagicDawn exists as an integrated plugin in WuWa’s production engine build — not a research paper, not a promotional claim, but a registered content path in the game’s own configuration. This upgrades the MagicDawn claim from “confirmed collaboration” to confirmed production engine integration.
The same Engine.ini also reveals several other notable Kuro custom plugins: KuroDynamicMeshBatch (custom mesh batching), KuroWorldPartition (custom World Partition), KuroPSOTools (PSO/shader caching), KuroPerfCat (internal performance profiling), FastGeoStreaming (experimental geometry streaming), and OpacityMicroMap (NVIDIA OMM — referenced in the Unreal Fest Tokyo 2025 presentation). The plugin list is consistent with a heavily customized UE4.26 build making selective use of both Kuro-developed and third-party rendering technology.
The specific features of MagicDawn that are active in production, their scope, and their contribution to rendering quality or performance have not been detailed in Kuro’s official patch notes. The integration is confirmed; the extent remains undisclosed.
What this does confirm is that Tencent is investing in rendering infrastructure at the research level relevant to WuWa’s visual ambitions, and that the relationship between MagicDawn and Kuro is active rather than speculative.
5. A Response to the Reddit Profiling Analysis
A detailed performance analysis was posted to the WuWa community by @xLOCKnLOADx, based on hardware traces from a Snapdragon 8 Elite device (https://www.reddit.com/r/WutheringWaves/comments/1rtuzc8/wuthering_waves_performance_issues_analysis/). I want to be clear upfront: the data in that post is real and worth taking seriously. The measured numbers — 50% primitive rejection in open world, up to 99% in combat, L1 cache miss rates of 70–100%, FP32 shader dominance — come from actual hardware traces and should not be dismissed.
An important platform caveat: this section discusses mobile profiling data. Mobile and PC systems differ fundamentally — mobile uses tile-based rendering, unified memory, and aggressive thermal/power management, while PC uses discrete GPUs, higher bandwidth memory, and different rendering pipelines. Metrics such as primitive rejection rates, cache behavior, and GPU utilization do not translate directly between platforms. The causal arguments made here apply to the mobile context specifically; PC behavior should be evaluated separately using PC-native profiling. The coordination bottleneck argument for PC is supported by separate PC-native data presented in Section 1.2.
The issue is with the framing, not the data.
The post treats each GPU-side problem as an independent optimization failure: culling should be better, texture batching should be better, shaders should use lower precision. All of these are individually accurate observations. The conclusion — that none of them require a new engine — is also accurate.
What the post does not explain is why culling fails specifically under combat load.
The 99% trivial rejection rate in combat is not culling code that was written poorly. It is culling code that did not have time to run — because by the time the game reaches the GPU submission step, the GameThread has already consumed its entire frame budget on particle system updates, scripting ticks, and actor physics. There was no time left for culling.
Fixing the culling algorithm while the GameThread is still saturated does not fix the problem. It fixes a symptom. The cascade looks like this:
Root cause:   GameThread saturation  ←  engine architecture
        │
        ▼
Symptom 1:   CPU-side culling runs out of time before GPU submission deadline
        │
        ▼
Symptom 2:   Unculled geometry submitted → GPU performs trivial rejection
              (50% open world, up to 99% combat)
        │
        ▼
Symptom 3:   Draw calls jump across unrelated textures → L1/L2 cache thrashed
              (L1 miss 70–100%, L2 miss ~45%)
        │
        ▼
Symptom 4:   GPU stalls waiting for memory, then waits again next frame
Treating Symptoms 2–4 as independent failures misses that they share a root. The GPU isn’t doing wasted work because someone forgot to write culling code. The GPU is doing wasted work because the code that would have prevented it didn’t get scheduled.
A note on causal attribution: the cascade above represents the most architecturally consistent explanation for the observed data, but it cannot be verified without full profiler access to the codebase. There are at least three plausible hypotheses for the culling failure: (1) GameThread has no time budget left for culling — the engine architecture explanation; (2) the culling algorithm itself is poorly implemented — an implementation quality issue; (3) the culling pipeline is structurally misdesigned for this workload — a hybrid of both. The honest position is that engine constraints and implementation quality are two separate variables whose individual contributions cannot be separated from the outside. Both are present. Their relative weight is unknown. This analysis treats hypothesis (1) as the primary explanation because it is most consistent with the broader data pattern, but readers should weigh that accordingly.
One additional data point worth noting: community engine configs confirm that r.ParallelFrustumCull=1 and r.ParallelOcclusionCull=1 are functional in WuWa’s shipping build — suggesting culling work can be partially offloaded from the GameThread to parallel threads. Whether this meaningfully shifts the bottleneck profile in dense city areas would require profiling to confirm, but their availability indicates the culling pipeline is not entirely GameThread-serialized.
— Flagged by @HtooMyatLin3
The Android Scheduling Dimension
The mobile profiling post also misses a platform-specific amplifier that matters for understanding the mobile experience specifically.
On Android, the Energy-Aware Scheduling (EAS) system manages which physical CPU core each thread runs on, dynamically migrating threads between the “big” (high-performance) and “LITTLE” (efficiency) clusters based on recent load history.
The problem: EAS uses a historical weighted average to decide where to place a thread. If the GameThread has been light for a few frames — say, during a loading transition — EAS may judge it as a light workload and assign it to an efficiency core. Then the scene becomes dense. The GameThread spikes. But the OS scheduler doesn’t react instantaneously: it takes time to recognize the new load level and migrate the thread to the prime core.
During that migration window, the GameThread is doing heavy work on a core not designed for it. The culling budget collapses further. The cascade gets worse.
The Android AOSP documentation acknowledges this problem directly:
“Without the scheduler change to make foreground apps more likely to move to the big CPU cluster, foreground apps may have insufficient CPU capacity to render until the scheduler decided to load balance the thread to a big CPU core.”
Source: https://source.android.com/docs/core/tests/debug/jank_capacity
This dimension does not exist on PC — x86 desktop CPUs are symmetric. Mobile stutter has this additional amplification layer on top of the same GameThread problem. The symptoms look similar; the mechanics are different.
On FP32: The Cross-Platform Constraint
The profiling post suggests transitioning to FP16 shaders as a quick optimization for mobile Adreno GPUs, where FP16 throughput is genuinely 2× faster.
This is accurate for Adreno. It ignores that WuWa runs on Adreno, Mali, Apple GPU, desktop AMD, desktop Nvidia, and Intel integrated graphics simultaneously. FP16 behavior and gain vary significantly across these GPU families. Maintaining separate shader variants per GPU family means larger pak files (the community has a separate ongoing conversation about WuWa’s storage footprint) and QA burden that multiplies with every device class.
The tradeoff is real. It is not as simple as the post implies. Community member @HtooMyatLin3 adds an important hardware-level nuance: FP16 throughput on GTX-series hardware (e.g. GTX 1060) runs at 1:64 ratio vs FP32 — meaning FP16 would be catastrophically slower on that GPU family. Dropping FP16 support for GTX would be required before any meaningful shader precision optimization could ship. By contrast, AMD RX 570 has identical throughput on both FP32 and FP16, so the optimization gap is highly architecture-dependent rather than a simple “switch FP16 on” solution.
The One Genuinely Easy Fix
The post documented r.Streaming.PoolSize = 400 from the Perfetto trace. On flagship mobile devices with 12–16 GB RAM, reserving only 400 MB for texture streaming is directly why L1 and L2 caches get thrashed — textures aren’t loaded into faster memory ahead of time because the pool is too small to hold them.
This is a configuration value. It has no architectural tradeoff. It is the one finding from that analysis that is genuinely addressable without any of the complications I’ve described elsewhere.
On r.Streaming.FullyLoadUsedTextures and r.Streaming.HLODStrategy: These are real UE4 engine cvars — FullyLoadUsedTextures forces all active textures to stream in immediately, HLODStrategy 2 disables HLOD-specific streaming entirely. Community member @HtooMyatLin3 reports that both cvars were usable in older patches (visible in earlier AlteriaX config commits) but are now being set by Kuro via code or console at a higher priority level — confirmed through log analysis — meaning Engine.ini entries are overridden and no longer effective at runtime. This represents a case where an easy fix was available, was being used by the community, and has since been locked down in the shipping build.
6. The Harder Truth
Where Kuro Actually Is
Kuro isn’t doing nothing. They’re also not in a position where they can optimize their way to smooth performance across all hardware tiers. What they’re in is something harder: a local optimal trap — a state where every available move makes something worse.
- If they pause content to do deep optimization work: player engagement drops, revenue drops, the project’s survival is threatened — which removes the budget and rationale for optimization
- If they keep shipping content without optimization work: technical debt compounds, performance degrades, player frustration grows
- If they attempt large architectural refactors: they risk catastrophic regressions in a live system that cannot tolerate them
Every direction has a cost. The current state isn’t laziness. It is the equilibrium that emerges when every alternative is worse.
The TS→C# migration is significant because it is not optimization within this trap — it is an attempt to change the shape of the trap itself. Local search — fixing individual culling issues, tuning shader precision — improves performance incrementally but cannot change the underlying constraints. The scripting migration is a structural change that opens solution space not accessible from the current position.
It will not fix the GameThread ceiling. UE4’s threading model will still limit how much work can be parallelized. But removing V8’s stop-the-world pauses from the frame budget gives the GameThread more headroom, and reduces the severity of the worst-case stutter events. That is a meaningful improvement even if it is not a complete solution.
Visual Ambition as Amplifier, Not Cause
A common narrative in performance discussions goes like this: “Kuro is too ambitious with graphics — if they toned down the visuals, the game would run fine.”
The hardware data does not support this.
The test is simple: if visual ambition is the root cause of stutter, then disabling it should eliminate stutter. Community Engine.ini configs from AlteriaX allow players to disable RT, reduce shadow resolution, lower ViewDistanceScale, cull foliage density, and reduce crowd density to near-zero. Players using these configs report better FPS — but Pattern A stutter in Academy and Pattern B spikes during boundary transitions persist. Severity decreases. The pattern does not disappear.
This distinction matters: severity is affected by visual settings. Existence of the bottleneck is not.
Three benchmark videos illustrate the hardware scaling pattern across very different visual configurations:
i5-4690 + GTX 750Ti, lowest settings, FSR on (v3.0, pre-3.1 streaming fix): Walking in Academy: high 30s–45fps. Using vehicle or fast movement: drops to mid-20s–35fps. Fast vehicle on open-world roads: stable ~30fps. Combat with complex VFX: mid-20s–30fps. — Benchmark
This is a GPU from 2014 with 2GB VRAM, on lowest settings. The game is playable. The stutter pattern — stable while walking, drops during fast boundary crossing and vehicle use — is identical to what higher-end systems experience, just at a lower FPS floor.
i5-1035G1 + integrated graphics, 8GB RAM, 720p lowest settings (below minimum spec) — @argon1ut:
Overall performance: ~15fps. Notably, frame pacing remained relatively consistent compared to higher-end systems operating at higher frame rates. Thread utilization pattern unchanged — a small number of threads dictated performance, TaskGraph workers continued sawtooth burst behavior. Worker thread activity appeared more uniform than on higher-end hardware, with reduced burst amplitude — likely because reduced main-thread throughput feeds work to workers at a slower, more consistent rate rather than in large bursts.
Despite 8GB RAM operating under significant memory pressure (fully utilized), this did not appear to be the primary driver of frame pacing — it contributed to overall performance cost without fundamentally altering the execution pattern.
Note: This system operates below minimum spec, introducing additional variance from memory pressure, reduced GPU throughput, and lower sustained CPU performance. Absolute metrics are not directly comparable. The purpose is behavioral observation under constraint — and within that context, results remain consistent with higher-end observations.
The most significant insight from this data point: at ~15fps, the frame time budget is ~66ms per frame vs ~16ms at 60fps. The coordination bottleneck is still present — thread utilization confirms this — but its impact on perceived smoothness is less visible because the system is already operating so far below the threshold where stutter is perceptible. This is consistent with the observation from GTX 750Ti users: the bottleneck pattern exists at all hardware tiers, but severity scales with the gap between hardware capability and engine ceiling.
i7-4790K OC 4.7GHz + GTX 1660 Super, low-medium settings, FSR on (v3.1): Pre-vehicle traversal: ~55–60fps. Vehicle inside Academy: 30–45fps. Vehicle on open-world roads: high 40s–50s. Combat: 35–60fps depending on VFX complexity. 1% low in Academy: 8–15fps. — Benchmark
The 1% low of 8–15fps likely captures Pattern B-like compound spikes during fast transitions, alongside regular city frame pacing instability from Pattern A, streaming warmup, shader compilation, and VFX complexity. A 4790K OC’d to 4.7GHz is still hitting the coordination bottleneck because IPC, cache behavior, memory latency, and GameThread workload matter more than raw clock speed here.
i7-9700K + RTX 2080 Super, high settings, no RT, DLSS Quality (v3.1): 1080p — walking in Academy: stable ~60fps. Vehicle inside Academy: 45–60fps. Open-world vehicle: stable 60fps. Combat: 55–60fps. 1440p — walking in Academy: avg ~47fps, range 47–60fps. Vehicle inside Academy: drops to ~40–50fps. 4K — Academy pattern similar to 1440p. Fast open-world movement: high 40s fps. Combat: high 40s–50s fps. — Benchmark
Note: RT is OFF in this configuration. No visual ambition premium being paid for ray tracing — yet the bottleneck pattern persists at 1440p and 4K as resolution increases and GPU becomes a co-factor.
What this data shows together:
Across these three hardware tiers — spanning GTX 750Ti to RTX 2080 Super, lowest to high settings, 2GB VRAM to 8GB VRAM — the same pattern repeats: stable traversal, drops during fast movement and boundary crossing, combat VFX adds additional pressure. The bottleneck mechanism is present at all tiers.
Visual ambition does contribute real cost — RT increases RenderThread pressure, complex VFX competes for GameThread budget, higher resolution increases GPU frame time. When these costs combine with the GameThread coordination bottleneck, frame budget shrinks faster and the ceiling becomes visible sooner. This is what @argon1ut describes: “visual ambition amplifies existing constraints in the engine.”
But the constraints exist regardless. Disabling visual ambition reduces severity. It does not eliminate the architectural bottleneck. The correct framing is not “Kuro is too ambitious with graphics, that’s why the game lags” — it is that Kuro’s visual ambition makes an existing architectural problem more visible, more frequently, across more hardware tiers.
The GTX 750Ti data makes this concrete: a card that cannot run RT, cannot handle high settings, running at lowest crowd density — still exhibits the same stutter signature. The engine architecture is the floor. Visual settings determine how quickly you hit it.
What “Poorly Optimized” Actually Means — and Why the Comparison Is Harder Than It Looks
When someone says WuWa is poorly optimized, the implicit benchmark is usually one of two things: “Cyberpunk runs smoothly at >=60fps, why doesn’t WuWa?” or “Genshin, AKE is smooth, why isn’t this?”
Both comparisons miss what WuWa is actually trying to do simultaneously.
There is also an expectation mismatch in the PC community. In markets where a configuration like i5-12400F + RTX 3060 is considered the mainstream gaming baseline, players are used to seeing well-optimized AAA games run smoothly and expect WuWa to behave the same way. That expectation is understandable — but it can also be misleading. At max settings, DLAA/RT, dense cities, high VFX density, NPC logic, streaming, and live-service content scale, WuWa is no longer behaving like a lightweight gacha workload. Its visual ceiling sits much closer to modern high-budget open-world titles than many players assume.
This is why CPU/GPU utilization alone can mislead the discussion. A custom-engine AAA title may keep the GPU saturated and feel smooth, while WuWa may show lower GPU usage and uneven frame pacing because the GPU is waiting on GameThread coordination, scripting, streaming, or RenderThread synchronization. That pattern is a real performance limitation, but it is not automatically proof that the renderer is inefficient or that the developers “did nothing.”
It is also important to separate game-level optimization from user-level configuration and runtime environment issues. WuWa has real engine/content-side problems: GameThread saturation, streaming spikes, shader/material warmup, GC pressure, mobile VFX/culling cost, and frame pacing consistency. But not every bad user report is clean evidence of game-level optimization failure. Wrong settings for the hardware, uncapped FPS, insufficient VRAM headroom, broken shader cache, overlays, NVIDIA Filters, Process Lasso affinity tweaks, forced priorities, aggressive INI edits, unstable RAM/CPU tuning, or driver/runtime conflicts can create or amplify stutter. Treating all of these as “bad optimization” makes the diagnosis worse.
Consider the full constraint stack Kuro is operating under:
- Open-world game with large, continuously loaded environments
- 3A visual ambition — lighting, geometry complexity, and effect density comparable to high-budget PC titles
- Dense populated cities with potentially hundreds of active NPC and interaction entities, some with AI behavior trees and scripting logic
- Combat-focused design requiring tight input latency, complex VFX, and simultaneous physics — all of which share the same GameThread budget
- Cross-platform — PC, PS5, iOS, Android, Mac — each with different GPU families, memory constraints, and scheduler behaviors
- Wide hardware range from flagship phones to budget Android devices, requiring config tuning that serves everyone
- Live-service 6-week cadence shipping new characters, areas, and systems continuously
- UE4 as foundation — a general-purpose engine not designed for any of these specific requirements in combination
No other game is currently doing all of these things together on UE4. Not Hogwarts Legacy (offline, no mobile, simpler combat). Not Tower of Fantasy (lower visual bar). Not Genshin (different engine, different architecture, lower graphical ceiling). The honest answer to “is WuWa poorly optimized compared to games in the same constraints?” is that there are no games in the same constraints to compare against.
Before concluding that WuWa’s performance is worse than it should be, you need to find another UE4 game that is simultaneously open-world, 3A visual fidelity, live-service at 6-week cadence, combat-heavy with complex VFX, cross-platform from mobile to PC, AND supporting a wide hardware range from budget devices to flagships. Until that comparison exists, the claim that Kuro’s optimization is below some reasonable baseline is not supported.
What we can say is that WuWa is running near the ceiling of what its engine architecture allows, given everything it’s attempting. That ceiling is real, it’s engine-level, and no external team has demonstrated how to escape it in a comparable context.
Cyberpunk runs on REDEngine — purpose-built for open-world performance by a studio that spent a decade constructing it. RDR2 runs on RAGE — over twenty years of iteration for dense open-world environments. These are not performance comparisons. They are comparisons between a general-purpose engine under pressure and custom infrastructure designed specifically to avoid that pressure.
The honest comparison is UE4 vs UE4: Hogwarts Legacy shipped CPU-bound in dense areas with Warner Bros. budget. PUBG — not an open-world game, but the longest-running UE4 title at scale — has required deep engine code modifications since 2017 per PlayerUnknown’s own words (“we’ve had to do a lot of changes to core engine code to make stuff work on that large a scale” — Rock Paper Shotgun), and community reports of micro-stutter and frame pacing instability persist across multiple years of that investment. As noted by @argon1ut, who has followed PUBG’s performance history closely: “so far I have only found PUBG as the highest likely candidate [for escaping UE4 limits], but nothing explicit yet outside of claims for modifying deep engine code.” Tower of Fantasy, the closest genre match, has faced performance complaints throughout its life. No clearly comparable UE4 open-world live-service title has publicly demonstrated a complete escape from this pattern.
One additional layer compounds everything: cross-platform support. WuWa ships on PC, iOS, Android, PS5, and Mac. Every optimization decision, every config value, every shader tradeoff has to work across GPU families from Adreno to Mali to Apple to desktop AMD and Nvidia, across devices from 6GB RAM phones to 64GB workstations. This is a constraint that single-platform games simply do not face, and it makes every “why not just fix X” question significantly harder to answer.
The accurate statement is not “Kuro failed to optimize something other studios got right.” The accurate statement is: hardware is not keeping pace with the technical debt and engine limitations that accumulate when a project of this visual ambition runs on this architecture, in a live-service deployment model that makes deep infrastructure changes nearly impossible.
That is a different diagnosis from “the devs are lazy.” And it points toward very different expectations.
One concrete data point grounds this: a game with genuinely poor optimization cannot be playable on an i5-4690 with DDR3 RAM and a GTX 750Ti 2GB — hardware from 2014 running below minimum spec. WuWa is. That is not the behavior of a game where engineers didn’t try. It is the behavior of a game where engineers worked within real constraints and still delivered a scalable experience across a hardware range few AAA titles attempt.
That said, the architectural context described in this analysis provides justification for current performance given current constraints — not a blank check for future patches. As C# migration matures, as MagicDawn integration deepens, as Tencent’s full backing enables longer-term architectural investment, the acceptable threshold shifts. If future cities released under significantly better resource conditions — v4.x, v5.x and beyond — exhibit the same Pattern A severity as Startorch Academy, the architectural constraint argument weakens and implementation quality becomes the more honest explanation. Startorch was a first-of-its-kind stress test for WuWa’s engine. Future cities at comparable density will not have that excuse. That is the bar Kuro now needs to clear.
TL;DR
Why WuWa stutters — the short version
The game’s performance in dense cities is bottlenecked at the GameThread — UE4’s central coordination point that all game logic must pass through. WuWa does use UE4’s TaskGraph worker thread system, but the coordination and synchronization overhead at the GameThread remains the ceiling when scene density is high. More CPU cores don’t solve this. My benchmark (i7-12700KF + RTX 5070, city traversal, no FG): GPU at 54–58% average while CPU max thread hits 97–100%. The GPU is waiting, not the bottleneck.
Think of it like a highway with eight lanes — but only one toll booth. All traffic has to merge and pass through that single point before anything can move forward. Add more lanes and the jam doesn’t get better. That toll booth is the GameThread. Startorch Academy has hundreds of NPCs, buildings with active interaction logic, and complex ambient systems all trying to pass through it simultaneously. The thread saturates. Everything waits.
Why can’t they just fix it?
Because the toll booth is part of how Unreal Engine 4 was designed. It’s not a bug Kuro wrote — it’s the architectural foundation that every UE4 game is built on. Hogwarts Legacy has the same problem. So does Tower of Fantasy. No clearly comparable UE4 open-world live-service title has publicly demonstrated a complete escape from this pattern.
What is Kuro actually doing?
Patching consistently — performance improvements appear in nearly every major update. And quietly migrating the scripting layer from TypeScript (which uses V8’s garbage collector) to C# (a runtime with incremental, low-pause GC). That migration is confirmed by runtime logs, binary analysis, and datamine evidence. It’s expensive and invisible to players — and they’re doing it anyway while maintaining a 6-week content schedule.
The bottom line
“Dev lazy” doesn’t explain why Hogwarts Legacy had the same stutter pattern on a Warner Bros. budget. “Engine ceiling + live-service technical debt” does. The claim that Kuro’s optimization is below par requires a comparable game — UE4, open-world, live-service, cross-platform, combat-heavy — to benchmark against. No public example clearly matching that comparison set has been demonstrated yet.
If you want the full technical breakdown of why each of these things happens at the architecture level — keep reading from the top.
Limitations of This Analysis
This analysis relies on datamined configuration files from Arikatsu/WutheringWaves_Data, personal benchmark captures (CapFrameX, i7-12700KF + RTX 5070 — two sessions: Huanglong and Startorch Academy; Ryzen 7 7800X3D + RTX 5070 — Startorch Academy), community-provided CapFrameX data from @argon1ut (Ryzen 9 7900X + RTX 5070 Ti), community-reported hardware traces, official Unreal Engine documentation, and community profiling data.
On the Puerts/V8 claim: This is now supported by direct evidence. Runtime log files (Client.log and multiple Client-backup-*.log) explicitly record V8 initialization, Puerts module loading, and V8 version strings on every launch. String extraction from Client-Win64-Shipping.exe yields identifiers including Puerts, PuertsJsEnv, KuroPuerts, TypeScriptGeneratedClass, and multiple /Game/Aki/TypeScript/ paths. FModel inspection of pak contents (via the community AES key archive at https://github.com/ClostroOffi/wuwa-aes-archive) reveals the ScriptAssemblies directory containing C# runtime assemblies deployed alongside the Puerts layer. This claim is confirmed, not inferred.
On the C# migration: The infrastructure is confirmed in datamine (aki_base.csv v2.8+, _csharp directories). The ScriptAssemblies pak contents confirm the C# runtime is deployed. Content migration is ongoing — the config files remain partially populated.
The 175ms and 245ms frame spike interpretations as GC pause events are consistent with V8’s documented behavior but cannot be confirmed without scripting VM profiler access. Both spikes are real and measured from hardware data. Their cause is the most technically consistent explanation available given the absence of GPU and thermal correlation.
The causal attribution between GameThread saturation and culling failure (Section 5) represents the most architecturally consistent explanation for the data, but cannot be fully separated from implementation-quality contributions without codebase-level profiler access.
On the customized UE4 build: Community engine config analysis reveals r.Streaming.UsingKuroStreamingPriority — a cvar not present in stock UE4’s streaming system — further confirming the engine has been substantially modified beyond a standard integration. Its documented behavior (controlling retention vs. load priority separately, with game-specific tradeoffs for different asset types) is consistent with a custom streaming pipeline built on top of the base UE4 framework.
Where direct evidence is unavailable, claims are labeled as inferred.
Official Vietnamese Facebook page: Page này lập ra để nói về tối ưu hóa của Ư Ư
Contributions & Corrections
This analysis is a living document. If you have additional profiling data, counter-evidence, corrections to technical claims, or insights that improve the accuracy of anything written here — I genuinely want to hear it.
All contributions that hold up to scrutiny will be incorporated into the article, and contributors will be credited by name (or handle) directly in the relevant section. The most up-to-date version of this article is maintained on GitHub — if you want to suggest a correction or addition, you can open an issue or reach out directly.
The goal isn’t to be right. The goal is for the best available explanation to exist somewhere people can find it.
Changelog
2026-05-26
- @argon1ut CapFrameX stress-test comparison added: Ryzen 9 7900X + RTX 5070 Ti, 1080p max settings + DLAA, no FG, no NVIDIA Filters. Added screenshot reference
capframex_startorch_7900X.pngand comparison against the author’s 7800X3D + RTX 5070 run. Framing updated: 7900X capture has the healthier tail metrics and was subjectively smooth, while 7800X3D still shows a very clean steady-state frame-time body. Stronger conclusion: X3D is likely the best hardware mitigation for WuWa’s cache-sensitive steady-state dense traversal workload, while worst outliers involve additional systems beyond cache locality. - NVIDIA Filters caveat added: the author’s 300–470ms 7800X3D spike cluster is now treated as suspicious external/compound-event behavior because that run used NVIDIA Filters while @argon1ut’s did not. The spike cluster should not be treated as clean CPU evidence until retested without filters.
- Expectation/configuration framing added: expanded the “poorly optimized” section to distinguish game-level optimization issues from user-level configuration/runtime mismatches. Added caveat that WuWa’s PC performance problems are real, especially frame pacing consistency and mobile scalability, but the “terribly optimized” narrative is often exaggerated when players judge the game only by CPU/GPU usage patterns or by comparison to custom-engine AAA titles.
2026-05-14
- Config C clarification (@argon1ut test cases): corrected framing — Config C was recorded inside Startorch Academy but in the entry/low-density zone before moving into high-NPC-density areas. GPU headroom at 768p is real at this location but does not represent Startorch peak stress performance — moving into dense NPC zones would cause GameThread coordination to saturate regardless of GPU load. Summary table updated to “Neither — Startorch entry zone, pre-stress” (Section 1.2)
- 7800X3D data added (author’s own benchmark): Ryzen 7 7800X3D + RTX 5070, Startorch Academy area, same settings as 12700KF baseline. Avg FPS 67.3 vs 38.5 on 12700KF — L3 cache nearly doubles avg FPS by reducing Pattern A cache miss penalty. 1% low 19.2 and P0.1 5.3 confirm Pattern B persists unaffected by L3 cache. Worst spike ~450ms noted with explicit caveat: cause is ambiguous (V8 GC, GPU headroom enabling aggressive streaming, shader compilation, or driver events — not a clean Pattern B measurement). Key takeaway: X3D is best hardware mitigation for Pattern A; it cannot address Pattern B. (Section 1.2)
- MagicDawn upgraded to confirmed production integration: WuWa’s shipping Engine.ini contains
Paths=../../../Engine/Plugins/MagicDawn/Content— direct evidence of MagicDawn as an integrated plugin in the production engine build. Claim upgraded from “confirmed collaboration” to “confirmed production engine integration.” Additional custom Kuro plugins documented from Engine.ini: KuroDynamicMeshBatch, KuroWorldPartition, KuroPSOTools, KuroPerfCat, FastGeoStreaming, OpacityMicroMap. (Section 4.3)
2026-05-12
- @argon1ut test cases expanded — three controlled configurations on Ryzen 9 7900X + RTX 5070 Ti documenting bottleneck behavior across resolution/settings spectrum: (A) 4K RT max nighttime: GPU 99%, FPS 35, 1% low 31; (B) 4K RT max daytime: GPU 99%, FPS 40, 1% low 15 — Pattern B compound spike confirmed independent of GPU load; (C) 768p low FG4x: GPU 37%, FPS 412, 1% low 200 — GameThread coordination not saturated with GPU underloaded. Together demonstrate that Pattern B fires regardless of primary bottleneck, and CPU waiting time vs computation time distinction. Section 1.2 updated with side-by-side image layout and summary table.
2026-05-02
- Lumen claim corrected (per @argon1ut): previous wording “confirmed Lumen hardware RT port” was an overclaim. Accurate description: custom Lumen-inspired GI system built by investigating and reconstructing parts of Lumen’s hardware RT approach — Surface Cache could not be ported and was replaced with a custom Clipmap Irradiance Cache. Approximation techniques used throughout (probes, SH compression, radiance caching). Result approximates similar lighting goals, not UE5 Lumen running in UE4 (Section 3.1 QnA)
- Timeline Problem section added (per @argon1ut, 2026-05-03): three-timeline framework explaining structural lag between engine evolution, game development cycles, and ecosystem adoption — why the same performance patterns appear repeatedly across modern titles regardless of studio effort. Summary: “Modern games are exposing problems from yesterday’s engine architecture, using today’s content scale, before tomorrow’s solutions are production-ready.” (Section 1.1)
- Primary source confirmed — Unreal Fest Tokyo 2025 (4Gamer.net): Wang Xin (Kuro Games rendering team lead) presentation at Epic Games Japan’s official event confirms:
- UE5 migration barrier confirmed in Kuro’s own words: “stability is paramount… a vast amount of assets were created with UE4 in mind, making it difficult to migrate to UE5 at this point” (Section 3.1 QnA)
- v2.8 RT optimization mechanism revealed: RHI thread fix for Gather Instances (3.2ms→), Build Acceleration Structure (2.8ms→), Bind SBT (2.4ms→) via thread splitting and pre-execution. Frame time with RT: 19.8ms → 10.5ms. RHI thread fix, not GameThread fix — explains why RT improved while Pattern A city stutter remained (Section 4.1 v2.8 entry). Credit: @argon1ut for flagging the RHI vs GameThread distinction.
- Mega Geometry/Nanite direction research confirmed — Kuro researching solutions for complex geometry, consistent with selective UE5 feature porting pattern (Section 3.1 QnA)
- Source: https://www.4gamer.net/games/634/G063420/20251117029/
2026-04-26 (addendum)
- Language tightening pass based on peer review from @argon1ut and community discussion:
- 1% low claim softened: “The 1% low is Pattern B” → “likely captures Pattern B-like compound spikes alongside Pattern A instability, streaming warmup, shader, VFX” (Visual Ambition section)
- “No UE4 open-world game has solved this. Not one.” → “No clearly comparable UE4 open-world live-service title has publicly demonstrated a complete escape from this pattern” — two instances updated (Section 6 conclusion + TL;DR)
- C# GC nuance added: “depending on runtime configuration” caveat, acknowledged C# also has stop-the-world phases in some modes (Section 2.3)
- NPC AI overclaim softened: “hundreds of concurrently ticking NPCs, each with full AI behavior” → “potentially hundreds of active NPC and interaction entities, some with AI behavior trees and scripting logic” (Section 6 constraint stack)
- PUBG added as supporting evidence with PlayerUnknown quote (Rock Paper Shotgun source) about deep engine code modification — PUBG’s persistent micro-stutter reports across multiple years support the argument that even heavily modified UE4 titles at scale mitigate rather than fully escape the pattern. @argon1ut observation credited.
2026-04-26
- Added new section “Visual Ambition as Amplifier, Not Cause” with four hardware benchmark references spanning below-minimum-spec to high-end (i5-1035G1 iGPU / i5-4690 + GTX 750Ti / i7-4790K + GTX 1660S / i7-9700K + RTX 2080S) demonstrating that stutter pattern persists independent of visual settings across all hardware tiers — visual ambition affects severity, not existence of the coordination bottleneck. Below-minimum-spec observation from @argon1ut: at ~15fps, coordination bottleneck confirmed present via thread pattern but less perceptible due to larger frame time budget (~66ms vs ~16ms at 60fps)
- Corrections and contributions from @argon1ut (@argon1ut, independent technical analysis):
- Cache miss language softened: “200 cycles every time” was presenting worst-case latency as constant. Corrected to reflect that many accesses hit L2/L3 rather than main RAM, and CPUs employ prefetching. Worst-case framing retained but qualified (Section 1.3)
- Lumen claim corrected: “mirrors features from UE5’s Lumen system” was imprecise — Lumen is not directly portable to UE4. Changed to “custom GI solution with goals comparable to Lumen.” Added Solon Lee source confirming team ported UE5-inspired rendering advances into UE4.26 build (Section 3.1 QnA)
- Shader compilation added as contributing factor to Pattern B compound events during boundary transitions (Section 2.2)
- Sawtooth/burst worker thread behavior added — more precise description of how workers activate in bursts then stall at sync points, framing the issue as coordination bottleneck rather than “workers do nothing” (Section 1.2)
- @argon1ut’s own 7900X + 5070Ti data added: GPU ~100% at 4K RT, CPU ~18%, minimal FPS gains from resolution reduction — confirms coordination bottleneck model from high-end PC perspective (Section 1.2)
- Mobile/PC separation caveat added to Section 5: mobile profiling data (tile-based GPU, EAS scheduling) does not translate directly to PC; platforms must be evaluated independently
- MagicDawn caveat updated: MagicDawn’s own promotional video confirms “powering Wuthering Waves” — collaboration is confirmed. However specific features/extent of integration remain unclear without Kuro patch note confirmation. Section 4.3 updated to reflect confirmed collaboration with appropriate nuance about scope.
2026-04-25
- Evidence contribution from @xLOCKnLOADx (author of the Reddit Snapdragon 8 Elite profiling post cited in Section 5): provided mobile per-thread load statistics showing GameThread AVG 74.9% MAX 93.9%, RenderThread AVG 65.1% MAX 83.8%, with TaskGraphHP workers at 13% and below, and V8 DefaultWorker instances confirming Puerts/V8 active at runtime. Thread-level comparison with Arknights Endfield (Unity Job Workers at 20%+ vs WuWa’s TaskGraph workers at <14%) provides direct architectural evidence for the OOP vs Job System difference discussed in Section 1.3. Section 1.2 updated with thread statistics table, images, and architecture comparison.
- Clarifications from @aizen76 (Representative & creator at Indie-us Games, Kansai-based UE specialist studio):
- Binned Allocator: UE4’s Binned/Binned2 allocator is a sophisticated tiered system that meaningfully improves per-allocation cache behavior and L1/L2 utilization — acknowledged in Section 1.3. The article’s core OOP traversal argument remains valid as the allocator mitigates micro-allocation overhead but does not co-locate actors that need to be processed together.
- Actor Clustering: corrected description — this feature optimizes GC pointer search by skipping random access during UE4’s garbage collection pass, not a Tick cache locality system. Its benefit is therefore more relevant to Pattern B (GC-related) than Pattern A (per-frame logic tick). Section 1.3 updated.
- Puerts usage scope: @aizen76 initially suggested Kuro stated Puerts is limited to non-core logic, but upon investigation found only a Bilibili conference presentation as source with insufficient specificity. This claim was retracted in good faith. No change to article’s Puerts analysis — V8 runtime presence in logs and migration evidence remain the primary basis.
2026-04-24
- Correction from @eggsee (WuWa mobile config creator): WuWa uses UE4’s TaskGraph system with multiple worker thread groups (NP/HP/BP), confirmed via client log from Poco F7/Snapdragon 8sGen4. The original framing of “one singular GameThread lane” was an oversimplification — GameThread is the mandatory coordination/sync point but async work IS dispatched to worker threads. Section 1.1 and 1.2 updated to reflect more accurate threading model.
- Added @eggsee’s observation on mip streaming competition in dense areas: occluded geometry still streams in, competing for mip bandwidth with visible content, contributing to Academy stutter independently of GameThread coordination overhead (Section 1.2)
- Added streaming warmup effect note: stutter in new areas improves after staying there as shaders compile and streaming stabilizes — ceiling is real but severity varies with streaming state (Section 1.2)
- Adjusted TL;DR to reflect corrected threading model
2026-04-21
- Added v3.3 patch entry (April 30, 2026): self-developed mobile frame generation, DLAA/Anisotropic Filtering on PC, mobile resource cleanup improvements (Section 4.1)
- Added community-sourced findings from @HtooMyatLin3:
- FP16 cross-platform constraint: GTX-series FP16 throughput runs at 1:64 vs FP32 ratio — hardware-level reason why FP16 shader optimization cannot ship without dropping GTX support first (Section 5 — FP32 cross-platform constraint)
r.ParallelFrustumCullandr.ParallelOcclusionCullconfirmed functional in WuWa’s shipping build — culling pipeline is not entirely GameThread-serialized (Section 5 — causal attribution note)r.Streaming.FullyLoadUsedTexturesandr.Streaming.HLODStrategywere usable in older patches but are now locked by Kuro at higher priority via code/console, confirmed through log analysis — Engine.ini entries no longer effective at runtime (Section 5 — The One Genuinely Easy Fix)r.Streaming.UsingKuroStreamingPriorityidentified as Kuro-specific cvar not present in stock UE4, additional evidence for customized engine build (Limitations)
- Added
r.ParallelFrustumCull/r.ParallelOcclusionCullfootnote to Section 5 causal attribution - Added
r.Streaming.UsingKuroStreamingPrioritynote to Limitations section